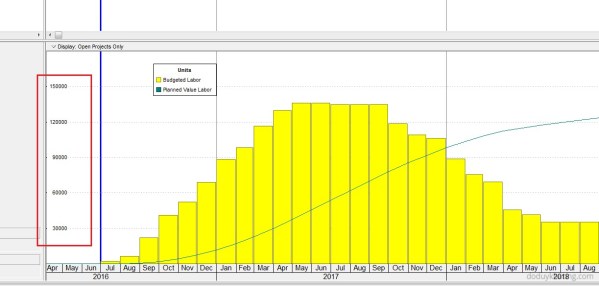
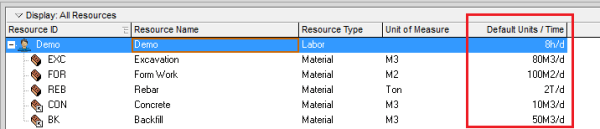
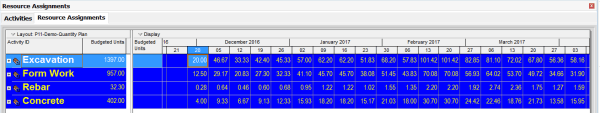
When using the Resource Usage Profile in Primavera P6, you may encounter an issue where the Unit of Measure (UOM) is not displayed. This can happen for several reasons, depending on the type of resource and your settings. 1. Material Resource Without a Defined Unit of Measure Cause: If the resource is a Material type, the Unit of Measure may not have... Continue Reading →
How to change currency in Primavera P6 and How is data stored when using multiple currencies
Sometimes, we work on projects that use a currency other than the US Dollar (USD). In this guide, I’ll show you how to create a new currency in Primavera P6 and use it in a project. Example Scenario Let’s say we have a new project that will use Malaysian Ringgit (MYR) as its currency. Step... Continue Reading →
How does Primavera P6 calculate Planned Value Cost for Activities without linear distribution (using Resource Curves or Manual plan) in Earned Value Management
When applying the Earned Value Management (EVM) technique in Primavera P6, one of the key metrics is Planned Value (PV), which is calculated as: Planned Value (PV) = Budget at Completion (BAC) × Schedule % Complete Earned Value (EV) = BAC × Performance % Complete (typically equal to Activity % Complete) Schedule Variance (SV) = EV – PV A positive SV indicates the project is ahead of schedule, making Planned Value a critical... Continue Reading →
How does Primavera P6 summarize data in the Summary / Grouping Band
When working with layouts in Primavera P6, it's important to understand how the software calculates and displays summary information for various data types such as costs, quantities, dates, durations, float, progress, and user-defined fields (UDFs). This article explains how these summaries are derived and what factors influence them. All summary calculations in P6 are based on the currently visible... Continue Reading →
Primavera P6 Professional : “Unable to connect to the database” error
When connect SQL database in Primavera P6 Professional, we usually have problem like: Error Message: Bad public user Name or password. SQL Server Error: [DBNETLIB][ConnectionOpen(Connect()).]SQL Server does not exist or access denied. Error message: Bad public user name or password. SQL Server Error: [DBNETLIB][ConnectionOpen (Invalid Instance()).] Invalid connection.;" Error Message: Bad public user name or password. Database Server... Continue Reading →
How to Print the Legend for Stacked Histogram in Resource Usage Profile in Primavera P6
When creating a stacked histogram in Primavera P6, you may notice that the legend does not appear by default in the printed report. This can make the report difficult to interpret, especially when multiple resources are displayed. For example, in the stacked histogram view (see image below), there is no visible option to include the... Continue Reading →
What is Primavera P6 Professional latest version?
Primavera P6 Version History / Latest Version Version Release Date Detail Information 18.8 06-Aug-2018 What's new in version 18.8 P6 Professional Version 18 Documentation 17.7 21-Jul-2017 What's new in version 17.7 P6 Professional Version 17 Documentation 16.2 30-Sep-2016 What's new in version 16.2 P6 Professional 16 R2 Documentation 16.1 31-Mar-2016 What's new in version 16.1... Continue Reading →
How to define Resource Productivity in Primavera P6 and create schedule
When building a schedule in Primavera P6, you can estimate activity durations based on resource productivity. Here's a step-by-step guide using a concrete example. Example Scenario A construction team can cast 10 m³ of concrete per day (this is the productivity). A foundation requires 100 m³ of concrete. Therefore, the activity duration is calculated as: Now, let’s implement this in Primavera... Continue Reading →
How to quickly identify Behind Schedule and Over Budget activity by Indicator UDF in Primavera P6
Primavera P6 allows users to efficiently track schedule and budget performance using graphical indicators in User Defined Fields (UDFs). This guide will walk you through the steps to create and use these indicators to highlight activities that are behind schedule or over budget. Identify Behind Schedule Activities Assume you have a project with a baseline... Continue Reading →
How to assign resource / resource loading / make resource plan in Primavera P6
After creating your project schedule in Primavera P6, the next step is to assign resources to activities in order to develop a comprehensive resource plan. In this guide, I’ll walk you through the process step-by-step. Step 1: Prepare Your Schedule Let’s assume you already have a schedule created, as shown in the image below: Step 2:... Continue Reading →
How to highlight a Time period in Gantt chart in Microsoft Project
Microsoft Project does not offer a built-in tool to directly highlight a specific time period in the Gantt chart. However, you can achieve this effect by using a custom calendar. Here's how: Create a New Calendar Go to the Project tab and select Change Working Time. Click Create New Calendar and name it something like "Gantt Shade". Define the Highlighted Time... Continue Reading →
How to filter based on WBS date in Primavera P6
We are working on a project that includes four buildings, as shown in the image below: Our goal is to filter and identify which buildings are scheduled to start within the next three months (December, January, and February). To do this, we can create a filter based on activity dates: Primavera P6 will then display... Continue Reading →

You must be logged in to post a comment.