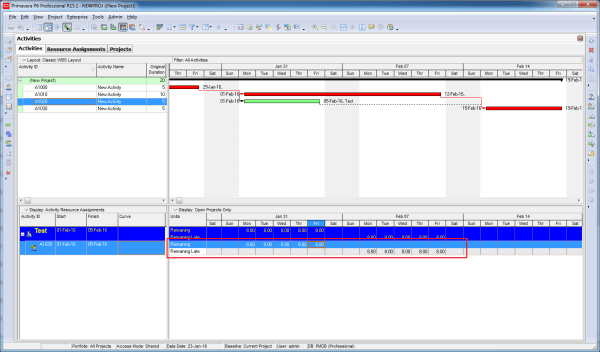
When working in Primavera P6, the Relationship tab is the standard way to view the predecessors of an activity. However, identifying those activities in the schedule can be challenging. Wouldn’t it be easier if we could see them directly in the Gantt chart? Here’s how you can do it: Step 1: Collapse All Go to... Continue Reading →
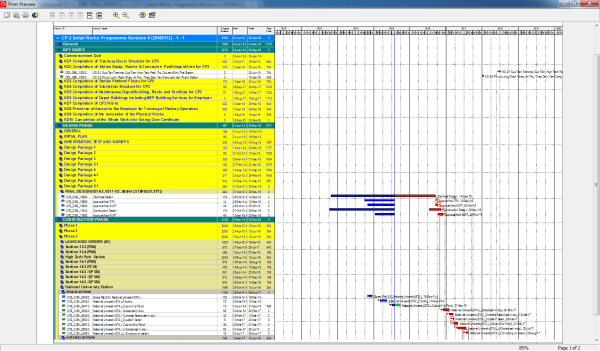
Create activity list report include predecessors and successors
Sometimes, you need a report that not only lists activities but also displays their predecessors and successors. Primavera P6 makes this possible through its reporting feature. Here’s how to do it: Step 1: Open the Report Window Go to the Reports window and click the “+” button to create a new report. Step 2: Select... Continue Reading →
Make report to Show only some WBS in Gantt chart
Sometimes, you need to create a report that focuses on specific WBS elements only. For example, you want the Gantt chart to show just the relevant activities without all the extra bars cluttering the view. By default, the Gantt chart displays all bars, which can be distracting. Here’s how to make it clean and focused:... Continue Reading →
Critical path by Total Float is wrong in multiple calendar project
In Primavera we can define Critial activities by 2 option: There are many reasons why we should choose Longest Path instead of Total Float. One of the reason is that when our project has multiple calendar. We have 4 activities which have same calendar : Standard 5 day workweek. We use Total Float to calculate... Continue Reading →
Critical path: Total Float vs Longest Path
Oracle Primavera P6 offers two ways to define a critical activity in a project schedule. These are: Total Float less than or equal to [0.0h] Longest Path Which one you use depends on three things. 1. the setting you choose in the Project view’s Settings tab: 2. the setting you choose in the Schedule Options... Continue Reading →
Graphing a P6 Resource S-Curve in Excel
Tutorial Files Excel Spreadsheet (Excel 2007+): P6_Scurve_Example.xlsx – 1.5Mb Step 1 – Export Primavera P6 Resource Assignments to Excel Following the steps from our previous tutorial, you now have all the resources and assignments in an Excel sheet. You can modify the primary sheet for better graphical features. Step 2 – How to Use the Data To draw... Continue Reading →
Convert Microsoft Project MPP to MPX to import to Primavera
Usually Microsoft Project saves file as MPP format. However, Primavera allows us to import Microsoft Project files in MPX format. So, here is the tool help you to convert MPP to MPX. Download from Google Drive: https://drive.google.com/file/d/0ByHnieTJNwKGdGVybE5LaElOcnM/view?usp=sharing&resourcekey=0-9JeuQrLavBI1ix781GGGRQ Download from Onedrive: https://1drv.ms/u/s!Air459YMTPJdkMEVJTjjyOf6L-1QCg?e=Xqusjj
Export data to Excel with “lowest level” summary data only
You create an Activity code to group data as you wish. After assigning and grouping activity by Activity code, here is the result: You want to export only the summary data to excel. So we will tick the "Show Summaries Only" option. However, you only want to export summary data at the lowest level. Because... Continue Reading →
When do we use “Store Period Performance” function?
What Does Store Period Performance Do Using the Store Period Performance feature, you can track actual units and costs to date each time the schedule is updated. For example, if you increase the actual this period by 50, the Project Management module increases the Actual to Date by the same amount. At the end of... Continue Reading →
Turn off Auto Compute Actuals for 1 activity
By default our project check this option like below image so that when you update Duration % complete, P6 will update Actual units for you. When you don't want this happen, you can turn it off. However it will apply to the whole project. How about you want to turn it off for only one... Continue Reading →
Does Resource Curve affect Remaining Late Unit
The Resource curve obviously affect Remaining Early Unit. How about Remaining Late Unit. The answer is YES. We have a resource assignment window showing Remaining Early and Remaining Late unit. When we apply resource curve. It affect both Early and Late unit.
Shortcut for moving WBS element
In WBS window, we can create a whole WBS structure by keyboard (faster than using mouse). In stead of click on the Plus icon to create a new WBS, we can press "Insert" button on keyboard. Enter the ID, press "Tab" then enter the name. We may want to move it left, instead of click... Continue Reading →

You must be logged in to post a comment.