How does Primavera P6 summarize data in the Summary / Grouping Band

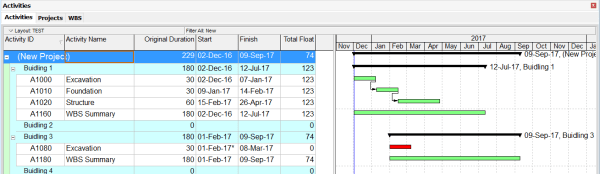
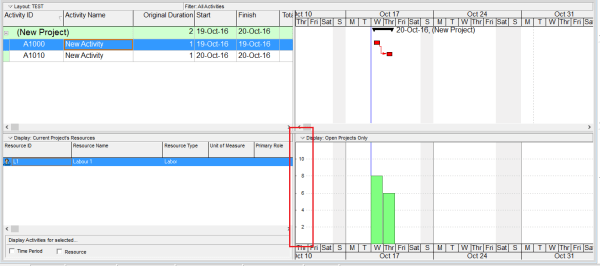
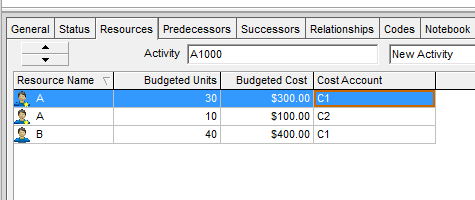
When working with layouts in Primavera P6, it's important to understand how the software calculates and displays summary information for various data types such as costs, quantities, dates, durations, float, progress, and user-defined fields (UDFs). This article explains how these summaries are derived and what factors influence them. All summary calculations in P6 are based on the currently visible... Continue Reading →

Primavera P6 Professional : “Unable to connect to the database” error

When connect SQL database in Primavera P6 Professional, we usually have problem like: Error Message:  Bad public user Name or password. SQL Server Error: [DBNETLIB][ConnectionOpen(Connect()).]SQL Server does not exist or access denied. Error message: Bad public user name or password. SQL Server Error: [DBNETLIB][ConnectionOpen (Invalid Instance()).] Invalid connection.;" Error Message:  Bad public user name or password. Database Server... Continue Reading →

What is Primavera P6 Professional latest version?

Primavera P6 Version History / Latest Version Version Release Date Detail Information 18.8 06-Aug-2018 What's new in version 18.8 P6 Professional Version 18 Documentation 17.7 21-Jul-2017 What's new in version 17.7 P6 Professional Version 17 Documentation 16.2 30-Sep-2016 What's new in version 16.2 P6 Professional 16 R2 Documentation 16.1 31-Mar-2016 What's new in version 16.1... Continue Reading →

How to define Resource Productivity in Primavera P6 and create schedule

When building a schedule in Primavera P6, you can estimate activity durations based on resource productivity. Here's a step-by-step guide using a concrete example. Example Scenario A construction team can cast 10 m³ of concrete per day (this is the productivity). A foundation requires 100 m³ of concrete. Therefore, the activity duration is calculated as: Now, let’s implement this in Primavera... Continue Reading →

Filter activity by Relationship Type in Primavera P6

Sometimes, we need to filter activities based on their relationship type. For example, you might want to display only activities with a Finish-to-Start (FS) relationship. Unfortunately, the default filter function in Primavera P6 doesn’t support this directly. But don’t worry — I’ll show you how to achieve this using the Report feature. Step-by-Step Guide Go to Tools → Reports. Click the Add button to... Continue Reading →

How is the Y-Axis scale determined in the Resource/Activity Usage Profile

When viewing the Resource Usage Profile or Activity Usage Profile in Primavera P6, you may notice that the Y-axis scale is automatically determined by the software. But how exactly is this value calculated? Let’s break it down. The Y-axis scale depends on the Timescale setting — whether it's set to week, month, or year. Based on this setting, Primavera identifies the maximum value (i.e., the tallest... Continue Reading →

Create a website or blog at WordPress.com

Up ↑