
Primavera P6 provides a useful tool called Progress Line, which allows users to visually compare Actual Progress (% Complete) with the Baseline directly on the Gantt chart.
Step-by-Step Guide
1. Project Setup
We begin with a simple project that has an assigned Project Baseline.

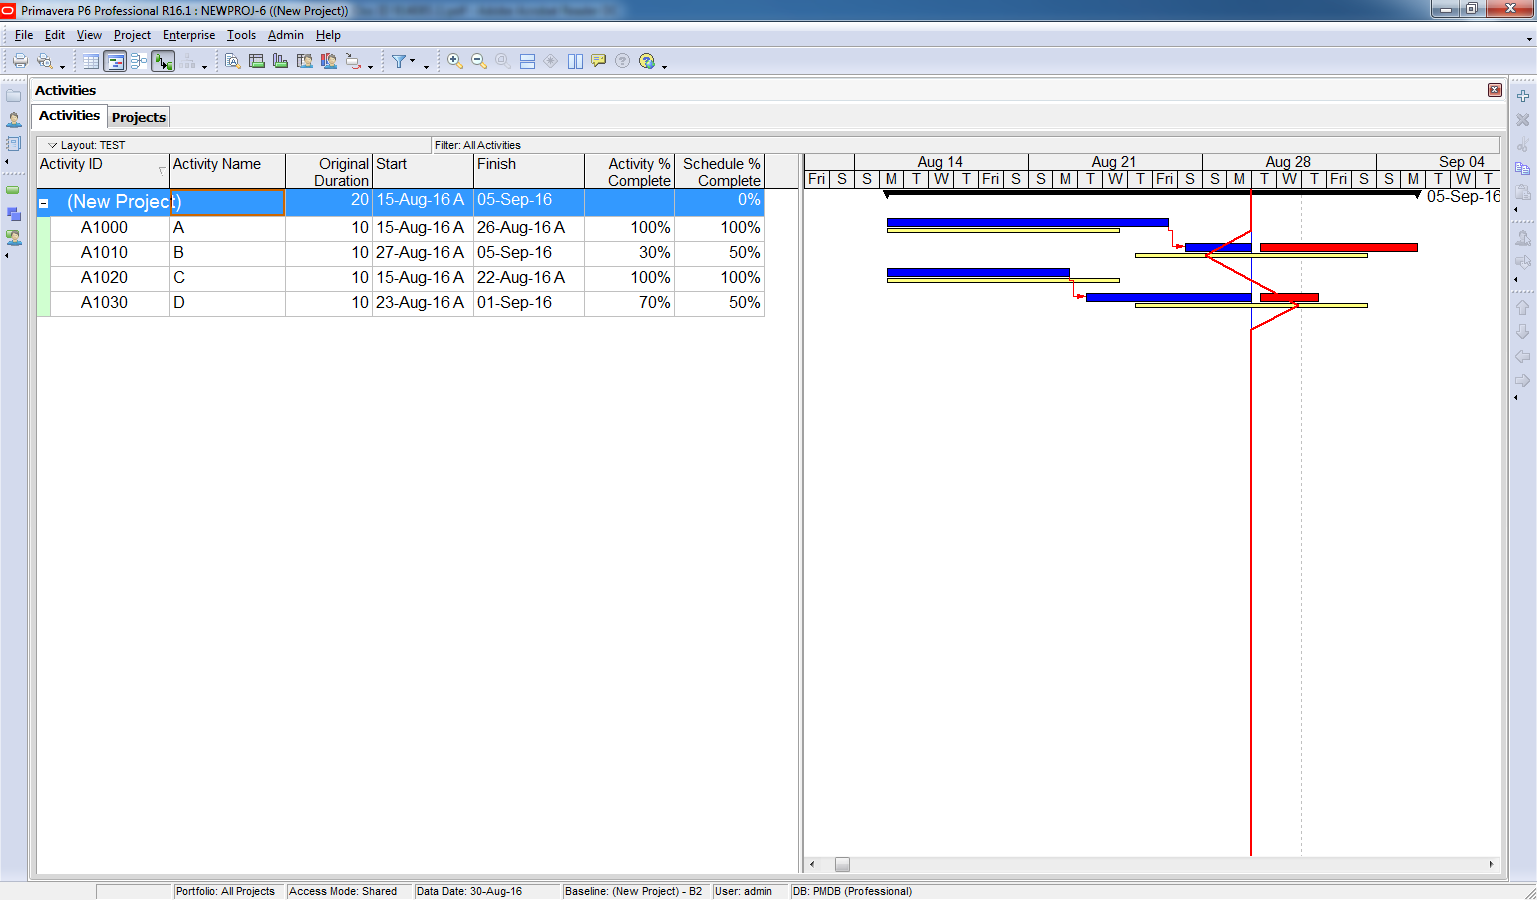
2. Update the Project
After updating the project:
- Activity A finishes 2 days late, causing Activity B to start late and fall behind schedule.
- Activity C finishes 2 days early, allowing Activity D to start early and move ahead of schedule.

Now, we want to visualize the current progress compared to the baseline.
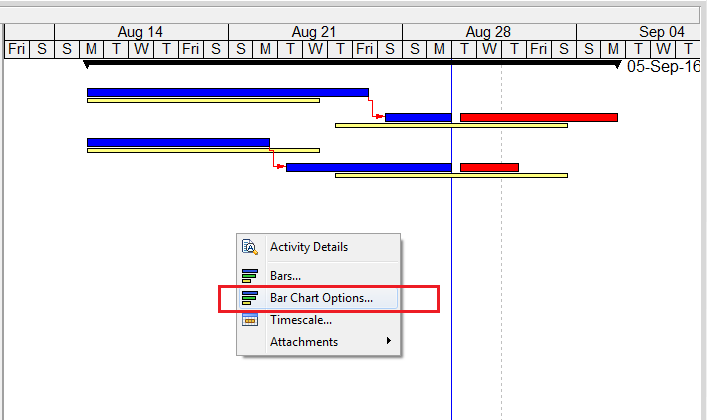
3. Enable Progress Line
- Right-click on the Gantt chart → Select Bar Chart Options
- Go to the Progress Line tab
- Choose:
- “By connecting progress points based on activity’s”
- “Percent Complete”
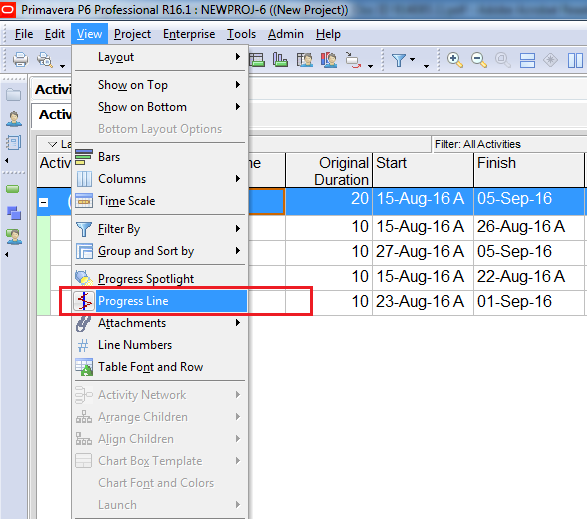
Click OK, then go to the View menu → Select Progress Line

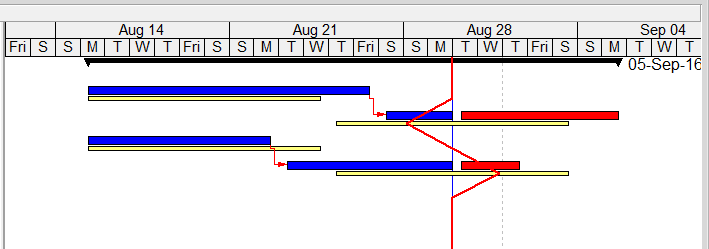
4. Interpreting the Progress Line
Primavera will display a vertical red line:
- The line shifts left if the activity is behind schedule
- The line shifts right if the activity is ahead of schedule
The point (where the red line connect) represent the Activity % Complete. But now it show on Baseline bar so that we know the activity is late or early.
Activity B is 30% complete, then the progress line will be drawn 30% of the way along the baseline bar.
Activity D is 70% complete, then the progress line will be drawn 70% of the way along the baseline bar.

This visual line helps quickly identify which activities are ahead or behind schedule..
Note :
Normally the Progress line is only used to analyze on-going activity. It will be drawn at same place with Data Date if:
- The activity is a Milestone.
- The activity does not exist in the baseline.
- The activity is completed.
- The activity is not started, and the baseline start is after or on the Data Date
Using the “Remaining Duration” Option
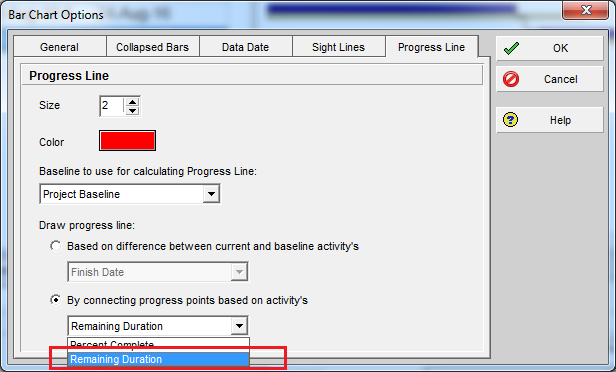
Alternatively, you can select the “Remaining Duration” option in the Progress Line settings.
The progress point is calculated as:
Progress Point = Baseline Finish – Remaining Duration
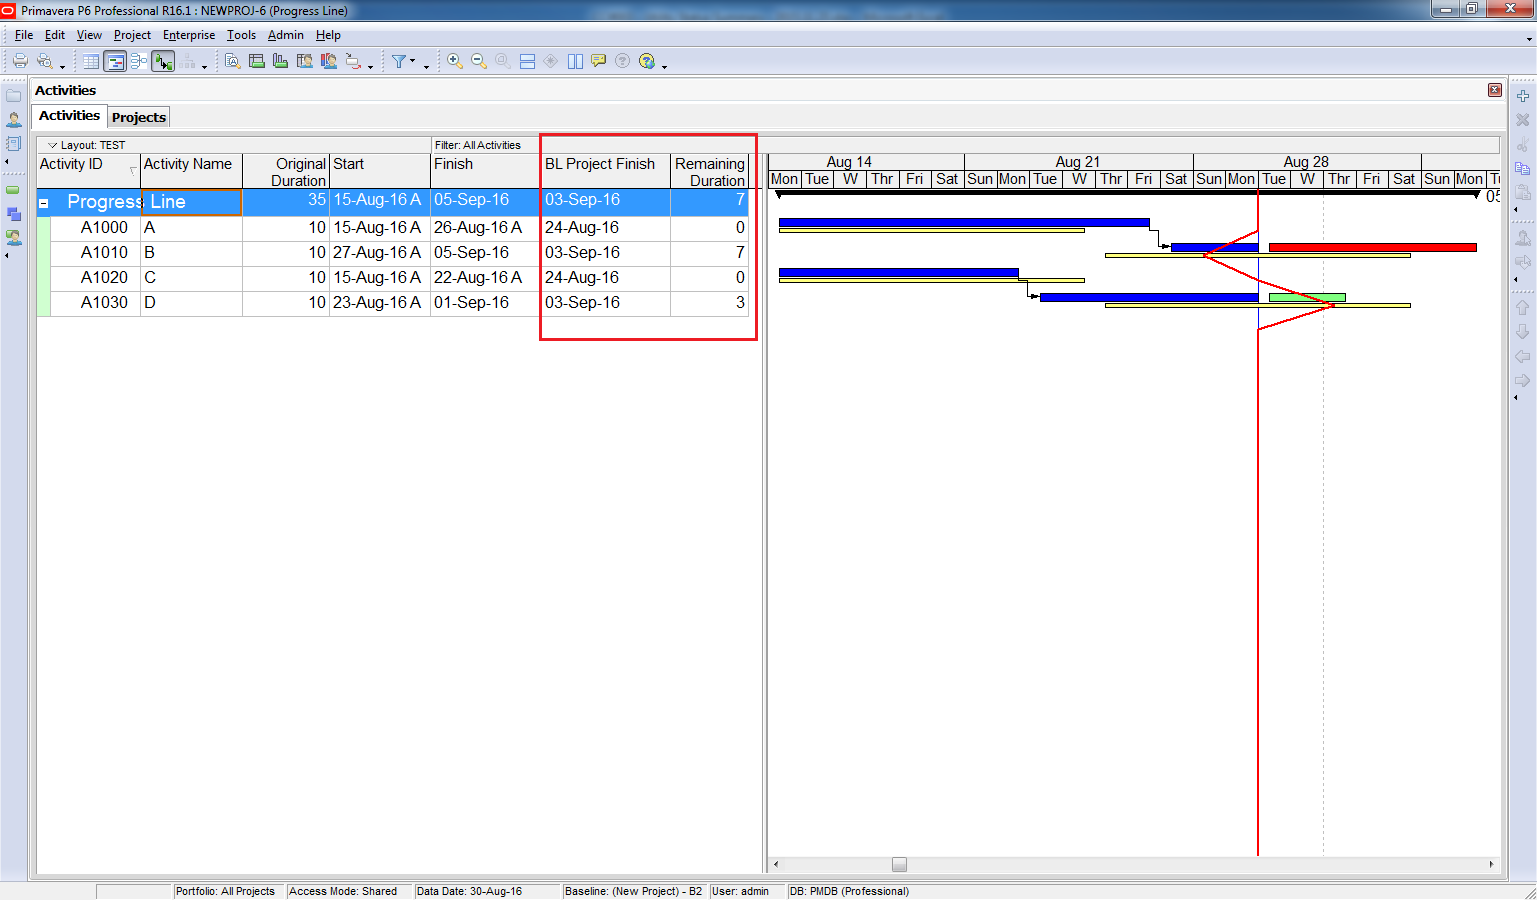
For example:
- Activity B: Baseline Finish = 03 Sep, Remaining Duration = 7 days → Progress Point = 28 Aug
- Activity D: Baseline Finish = 03 Sep, Remaining Duration = 3 days → Progress Point = 01 Sep
With this option we can also quickly see which activity is behind schedule and which activity is ahead schedule.

Dear Sir;
Its a nice blog i have learn a lot since i have started reading the blog…but I need Help..
To calculate man-hours and duration for activities..
If some body can help please reply….I have so much to learn..
LikeLike
Hi there,
It is affected by lots of element like resource capacity, resource availability… You can refer to PMBOK (Project management body of knowlege) to learn this skill.
LikeLike
To calculate man-hours, you need to have a reference for productivity and a quantity that can be obtain from Bill of Quantities. For example if you have a reference for the productivity of CHB Laying (lets say 2.5 MH/sqm), and the total quantity of CHB laying is 10 sqm, you can easily calculate man-hours with the simple math (2.5 x 10) which results to 25 man-hours. Duration can be calculated based on the available resources on site. Lets say you have 5 masons that will perform the CHB Laying, then you’ll have 5 hours as duration (25 man-hours/5 man).
LikeLike
Thanks….That’s very helpful
LikeLike
Thanks Jan,
Very clear and useful.
LikeLike
Hi! This is an excellent blog for Planners and I wish you all success in future.
I need a solution for below query.
I have prepared a resource loaded schedule where some general activities are not resource loaded (Design Preparation, Approval, Manufacturing, Delivery etc). I have approved baseline plan already and I am verge of updating the Progress. Now I want to show up the planned % Progress (for entire life cycle of the project as in baseline) and actual % Progress (for the current month).
Is there a way to do it in Primavera? Can you please help me?
LikeLike
Hi Mohamed,
Thanks for your compliment 🙂
Regarding your question, I think Earned Value Management can be very useful in your case.
You can see how to use it here : https://doduykhuong.wordpress.com/2016/08/08/how-to-use-earned-value-management-in-primavera-p6/
LikeLike
Thanks for the swift reply but I would like to iterate that my schedule is not cost loaded just resource loaded. I want to show my client for the month of X-2016 till the end of the project my planned progress in terms of %.
Then I want to show actual progress accrued against that every month.
LikeLike
That’s very useful.
LikeLike
Can you please explain the difference in updating progress without changing data date (i.e keeping the data data same as project start date) Vs. changing the data date (i.e current date)?
LikeLike
Hi Surabhi.
I think we always need to change data date when updating progress.
I have never heard the method of keeping data date same as project start date
LikeLike
Really Helpful
Thanks
Best Regards
LikeLike
Sir,
Can u tell me how to compare progress with data date and baseline schedule
LikeLike
Hi, its a nice blog. I would like to clarify some details. you said that if the activity is delay, the progress line would go to the left and if ahead it will go to the right. What if activity B is 90% completed, it will go to the right or left?
LikeLike
Hi.
It will go to the right.
If Activity B is 90% complete, then the progress line will be drawn 90% of the way along the baseline bar.
LikeLike