

Primavera P6 provides a powerful technique called Earned Value Management (EVM) to monitor and control project performance.
This article explains the concept of EVM and demonstrates how it works in Primavera P6 through a simple example.
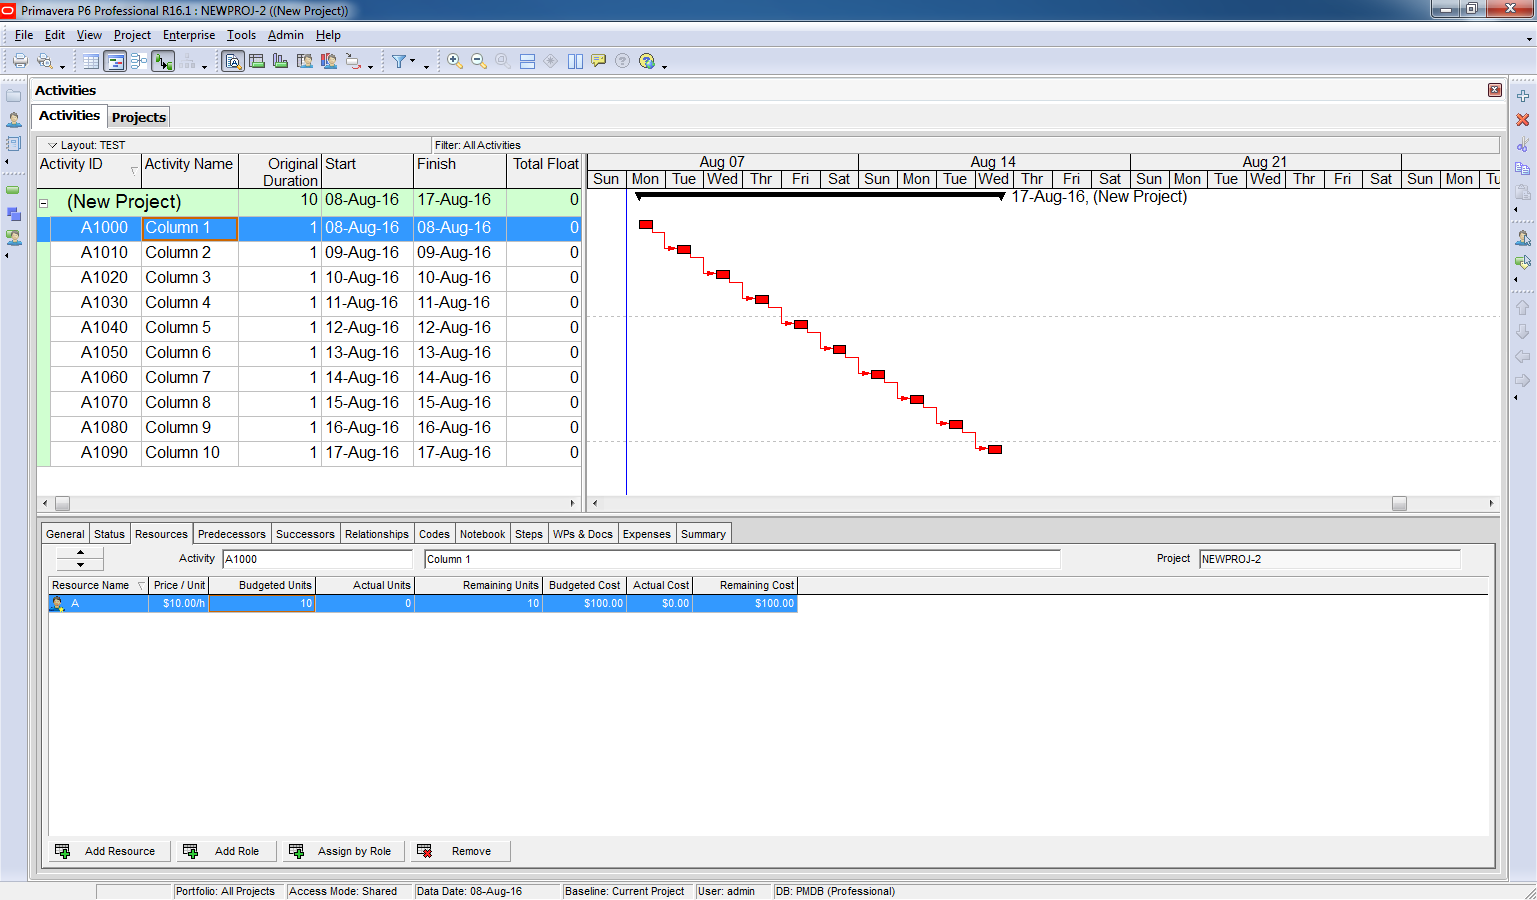
Example Project
We have a small project to cast 10 columns:
- Productivity: 1 column per day
- Cost: $100 per column
- Resource: Each activity is assigned to Resource A
Step 1: Create a Baseline
To use EVM, we first need to create a baseline for the project:
- Navigate to Project → Maintain Baselines
- Click Add, then OK to create the baseline

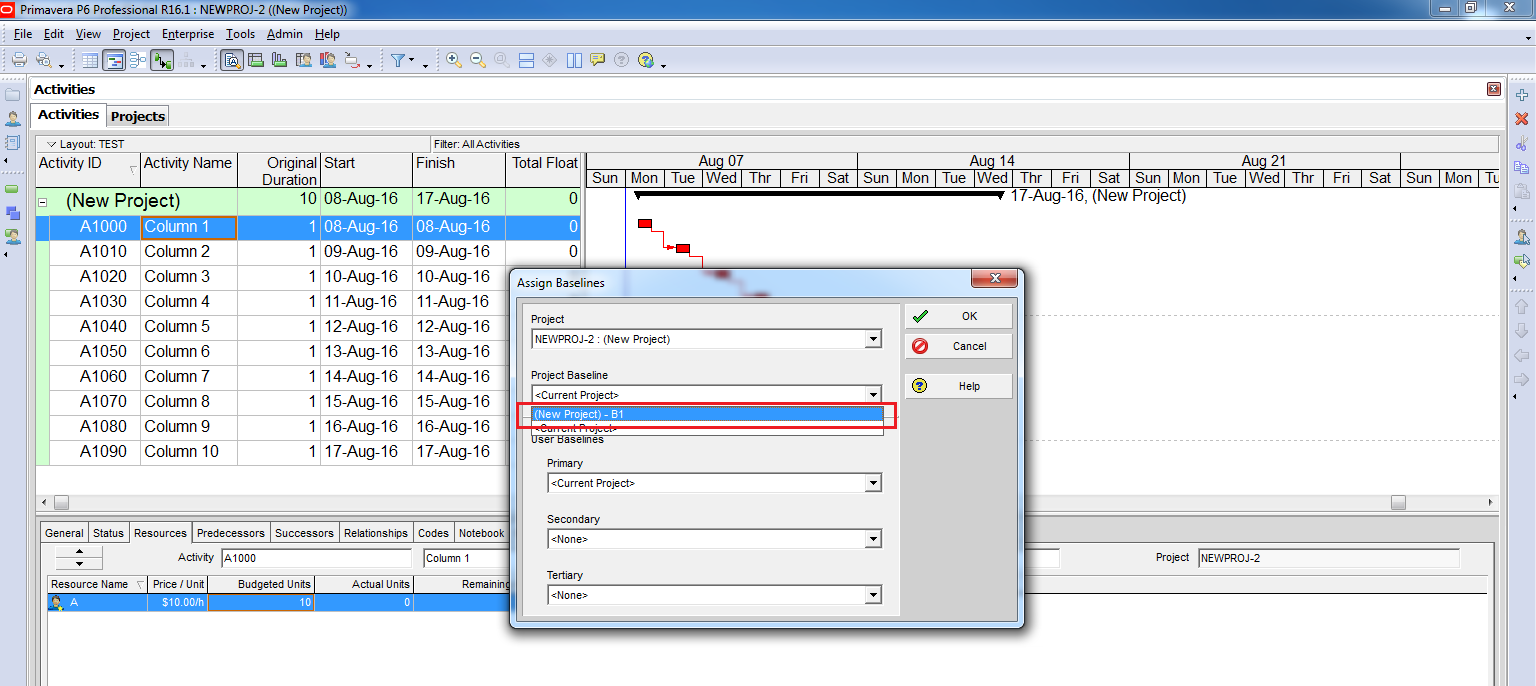
Step 2: Assign the Baseline
Next, assign the baseline to the project:
- Go to Project → Assign Baselines
- Select the baseline under Project Baseline, then click OK
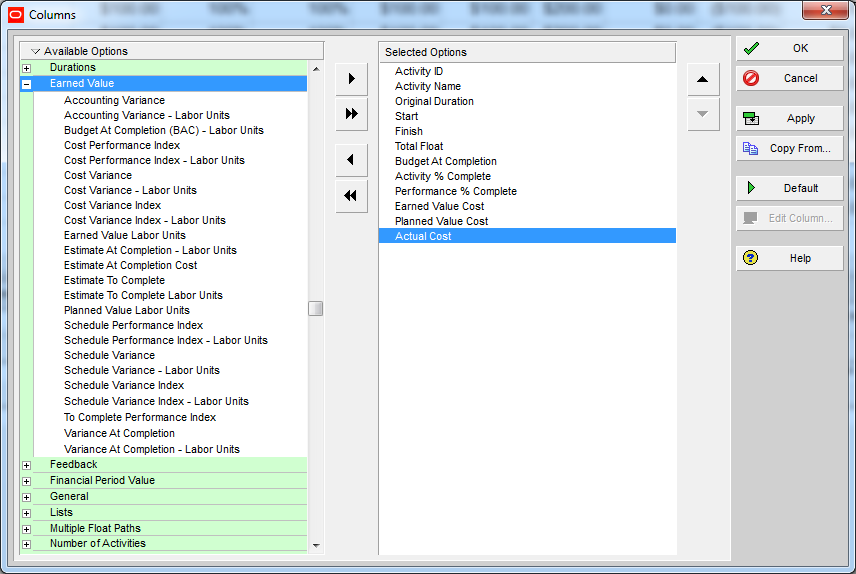
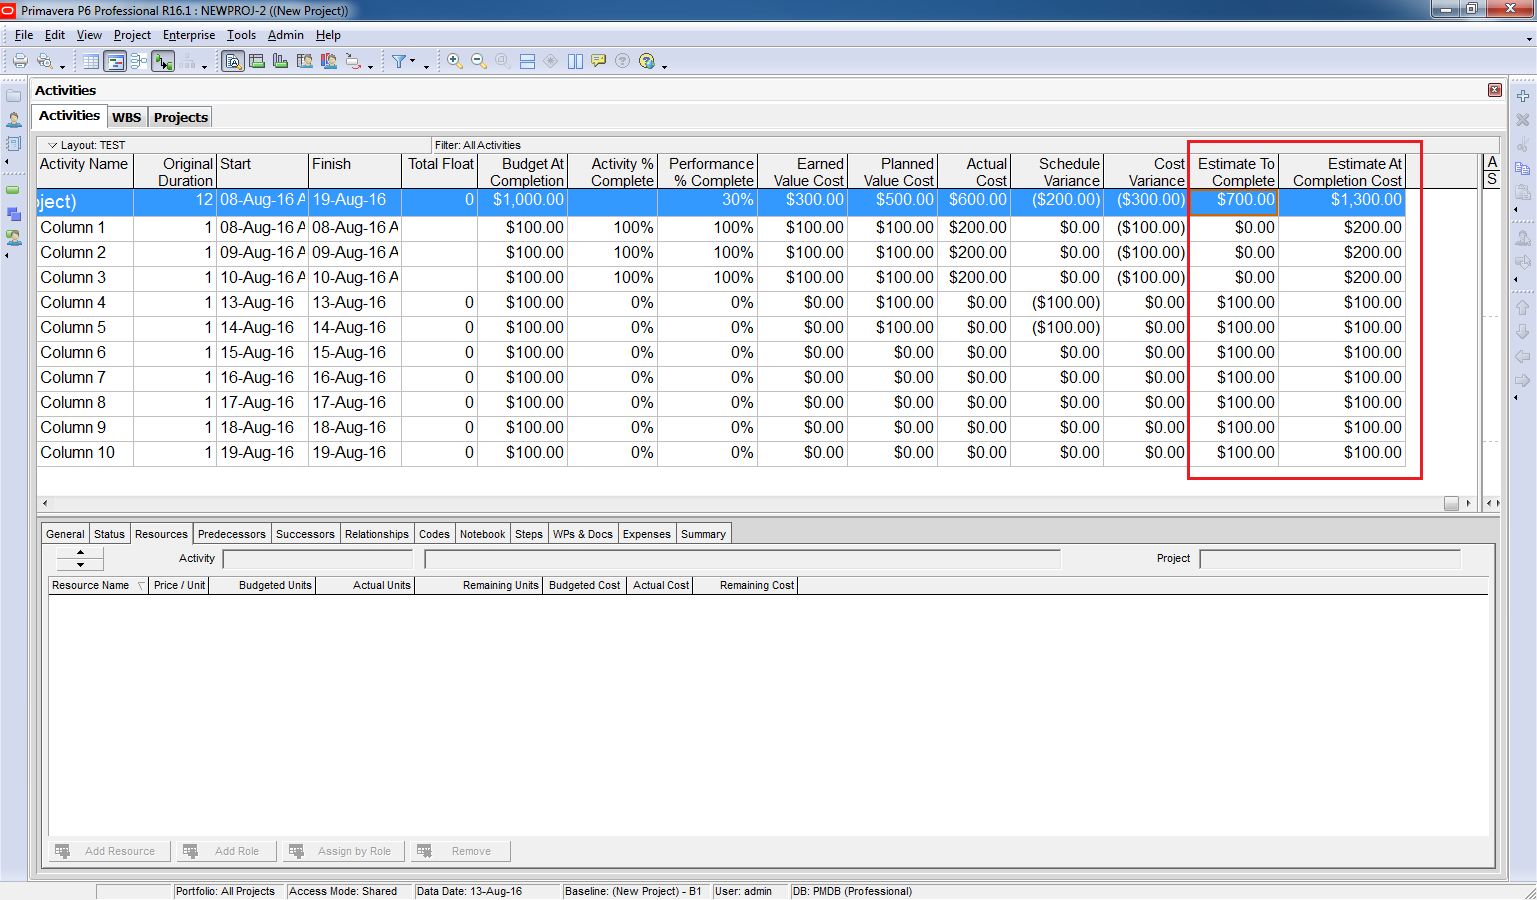
Step 3: Display Earned Value Columns
To analyze EVM data:
- Right-click on the Activity Table → Columns
- Select columns from the Earned Value group
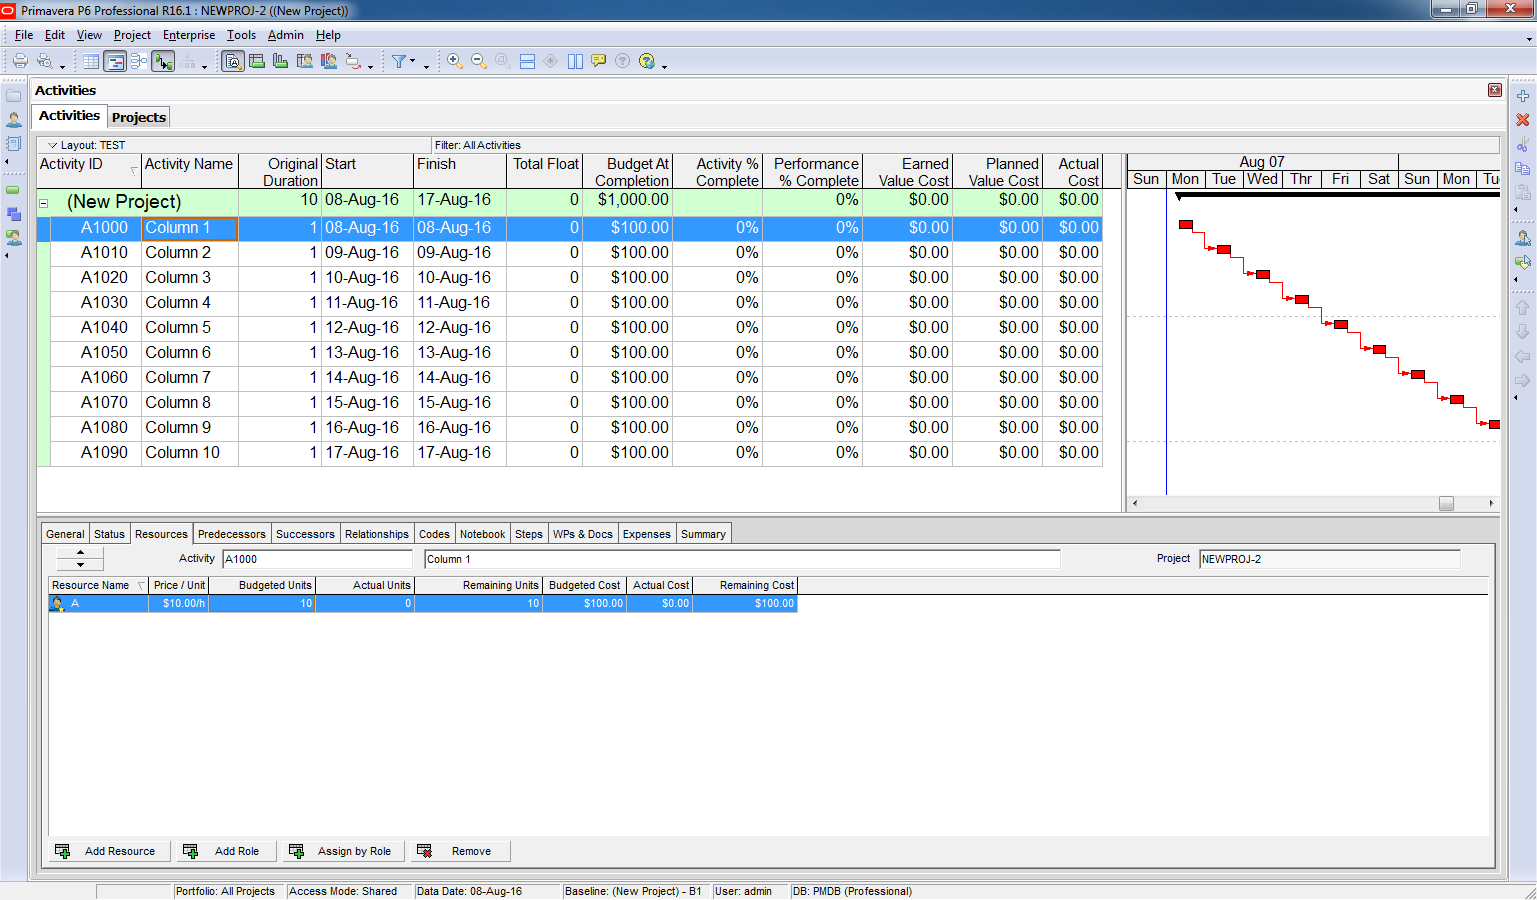
Step 4: Calculate Key Metrics
At the end of Day 5, let’s calculate:
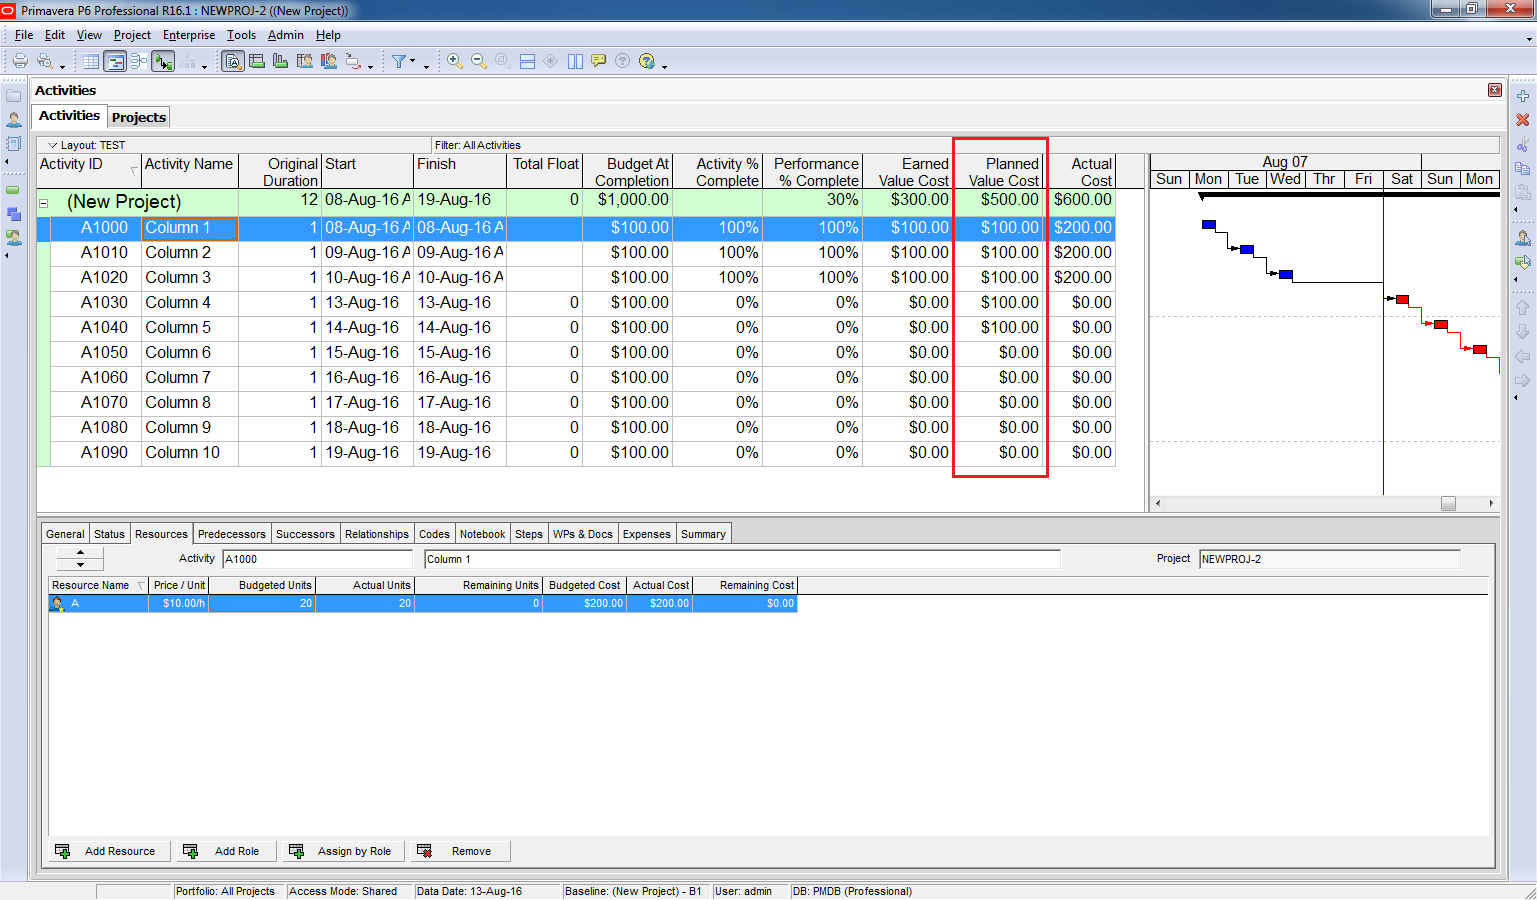
Planned Value (PV)
How many columns should have been completed?
- Baseline indicates 10-day duration, so by Day 5 → 5 columns
- PV = 5 × $100 = $500
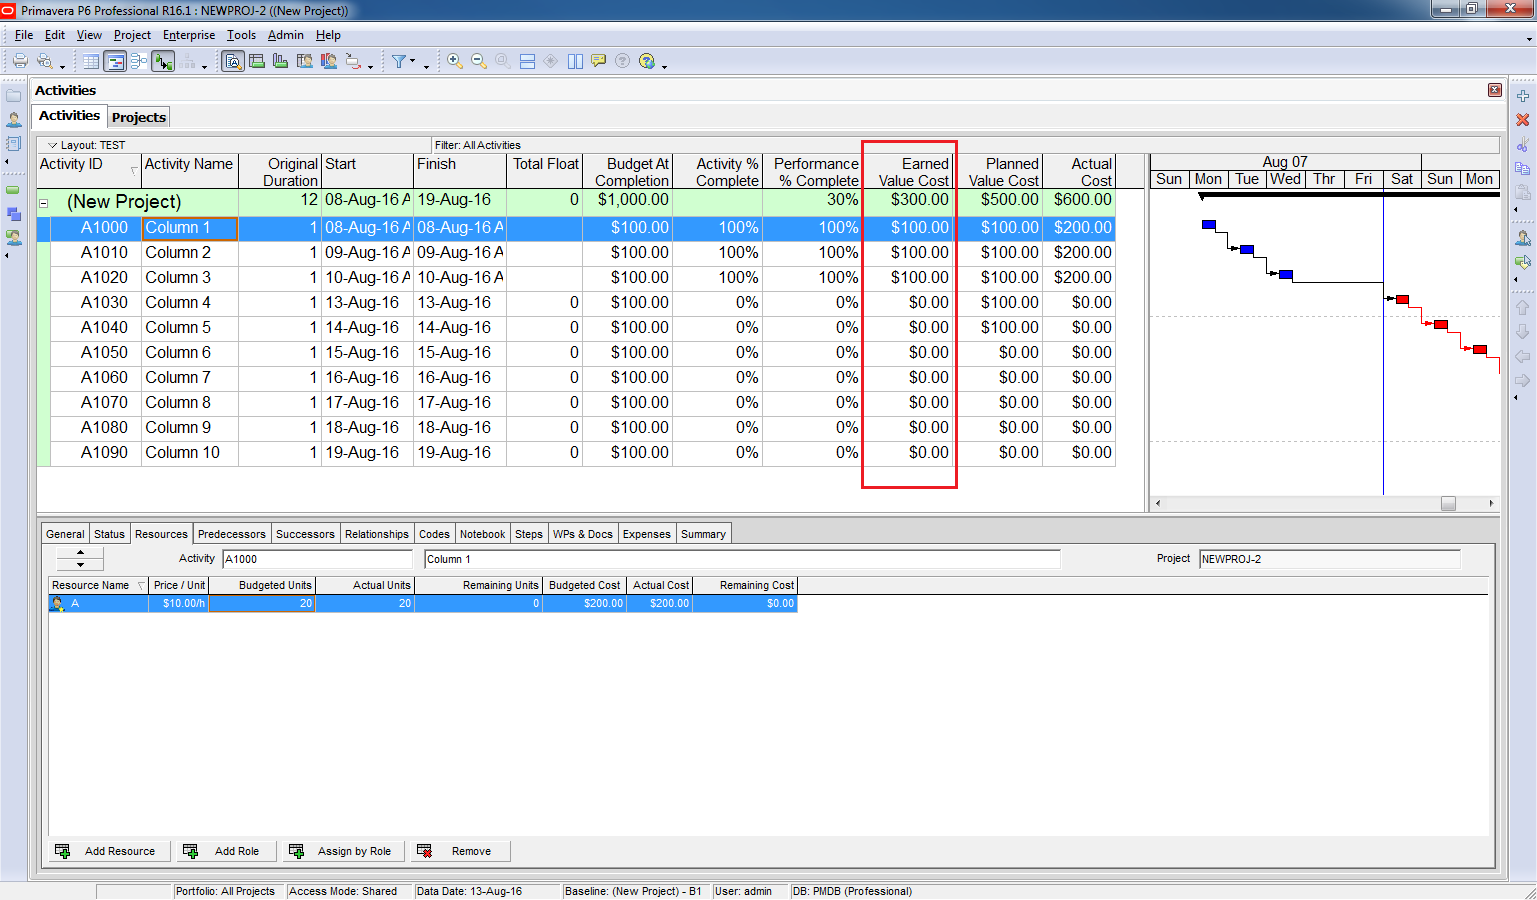
Earned Value (EV)
How many columns were actually completed?
- Report shows 3 columns finished
- EV = 3 × $100 = $300
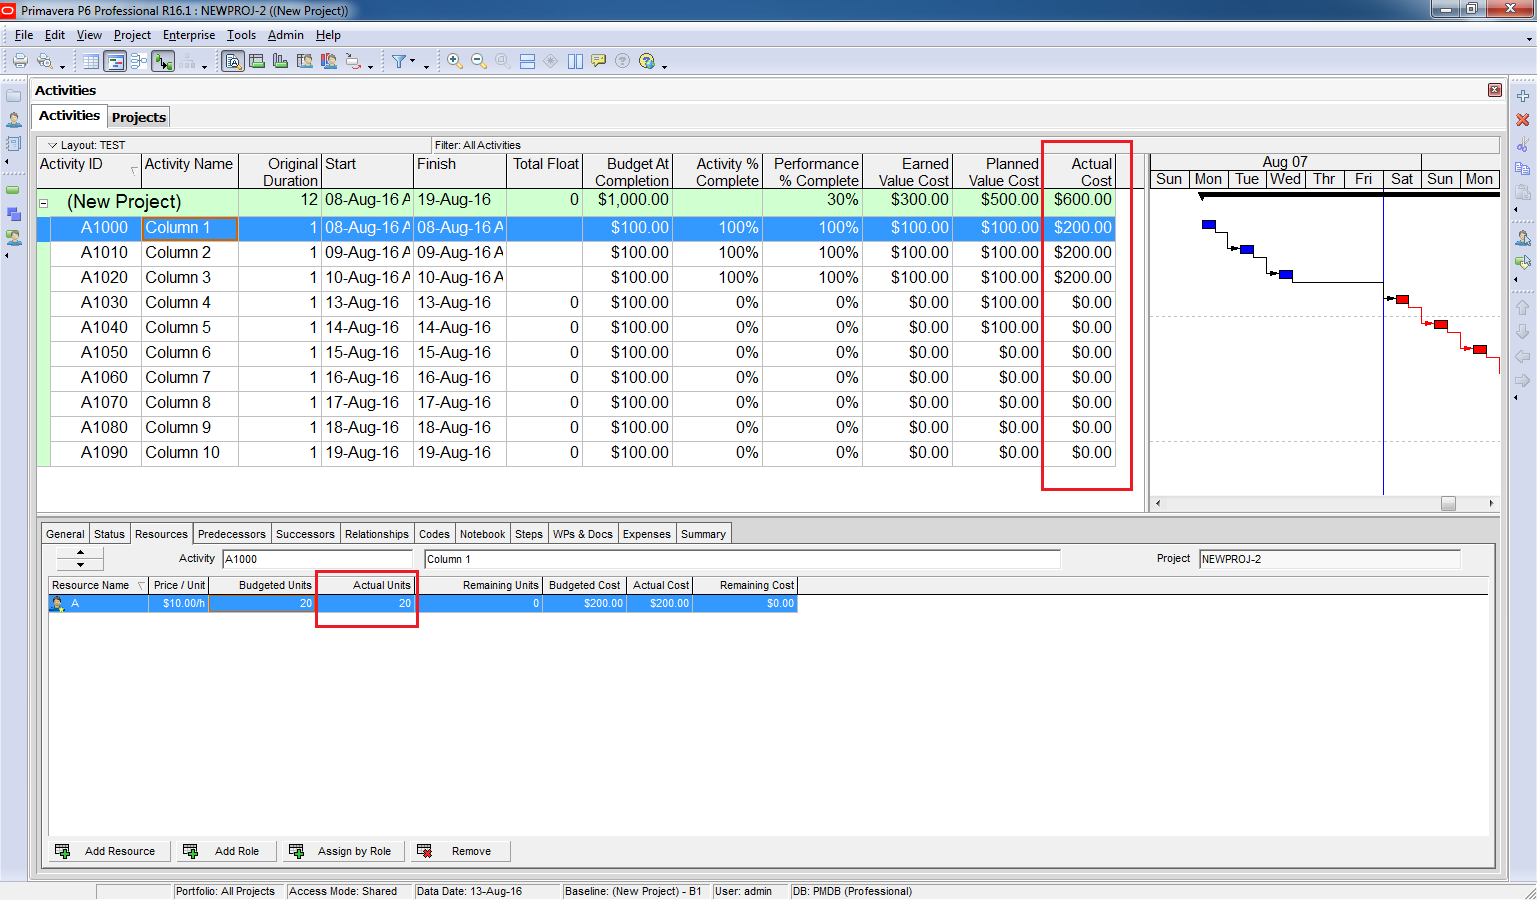
Actual Cost (AC)
How much did those 3 columns cost?
- Report shows $200 per column
- AC = 3 × $200 = $600
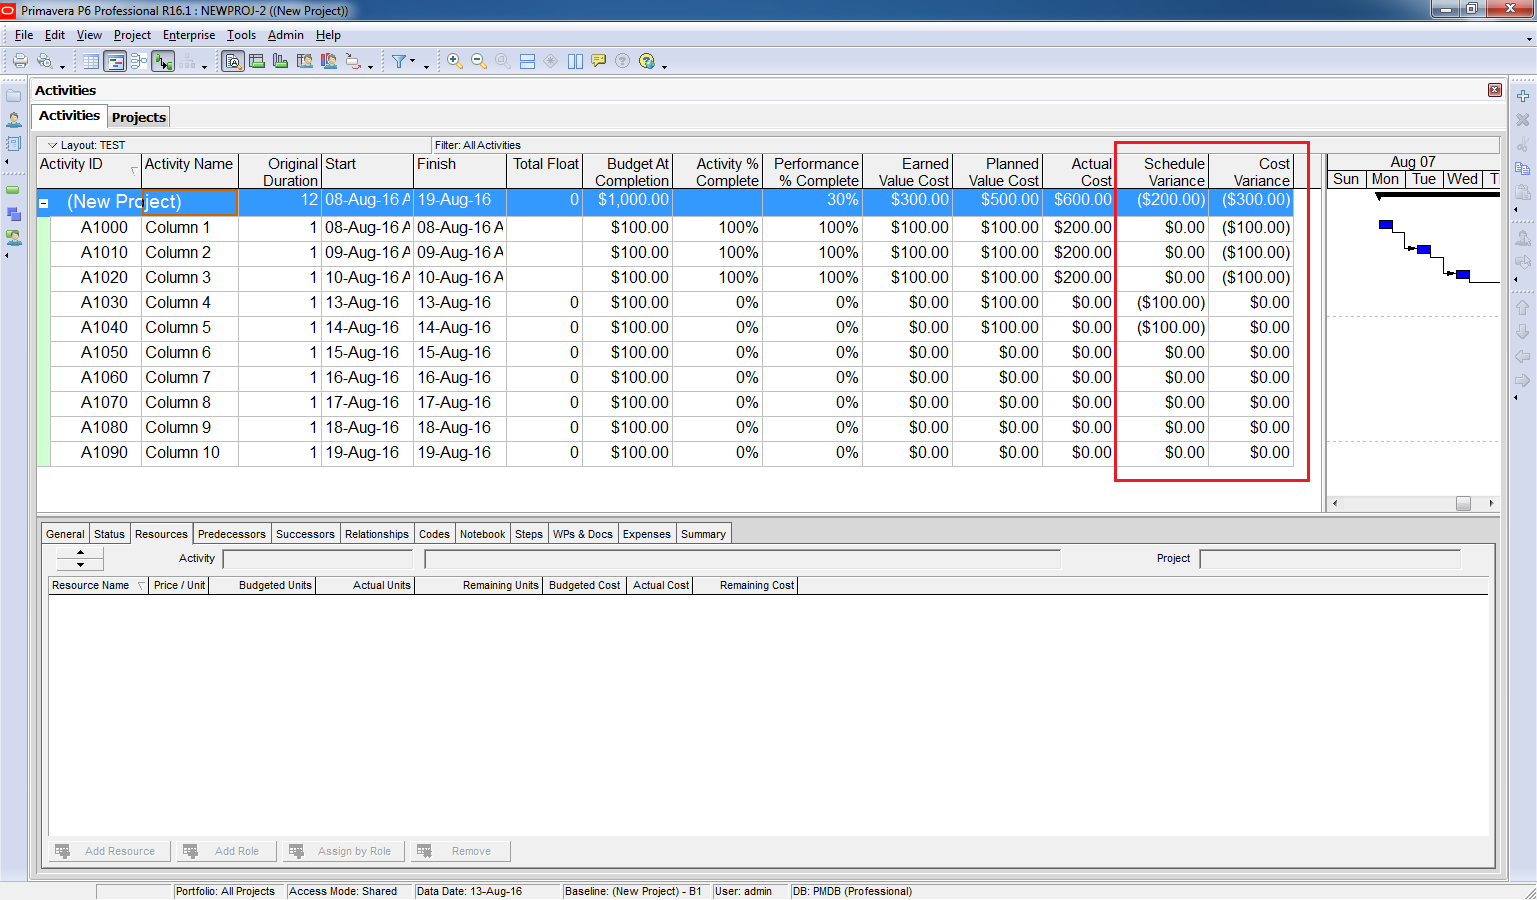
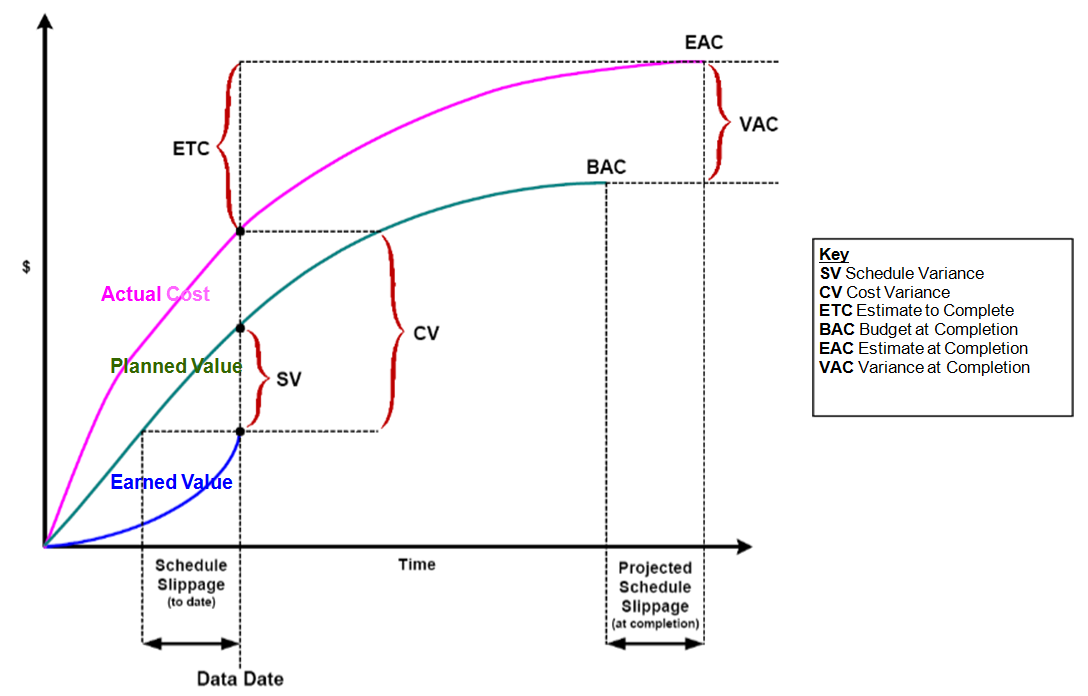
Step 5: Variance Analysis
- Schedule Variance (SV) = EV – PV = 300 – 500 = –$200
Negative SV means the project is behind schedule (about 2 days late). - Cost Variance (CV) = EV – AC = 300 – 600 = –$300
Negative CV means the project is over budget by $300.
Step 6: Forecasting
- Budget at Completion (BAC) = $1,000
- Estimate to Complete (ETC) = BAC – EV = 1,000 – 300 = $700
- Estimate at Completion (EAC) = ETC + AC = 700 + 600 = $1,300
To follow PMI standards, include Cost Performance Index (CPI):
- CPI = EV ÷ AC = 300 ÷ 600 = 0.5
- ETC = (BAC – EV) ÷ CPI = 700 ÷ 0.5 = $1,400
- EAC = ETC + AC = 1,400 + 600 = $2,000
(Enable this option in WBS → Earned Value tab → PF = 1 / CPI before updating the project.)

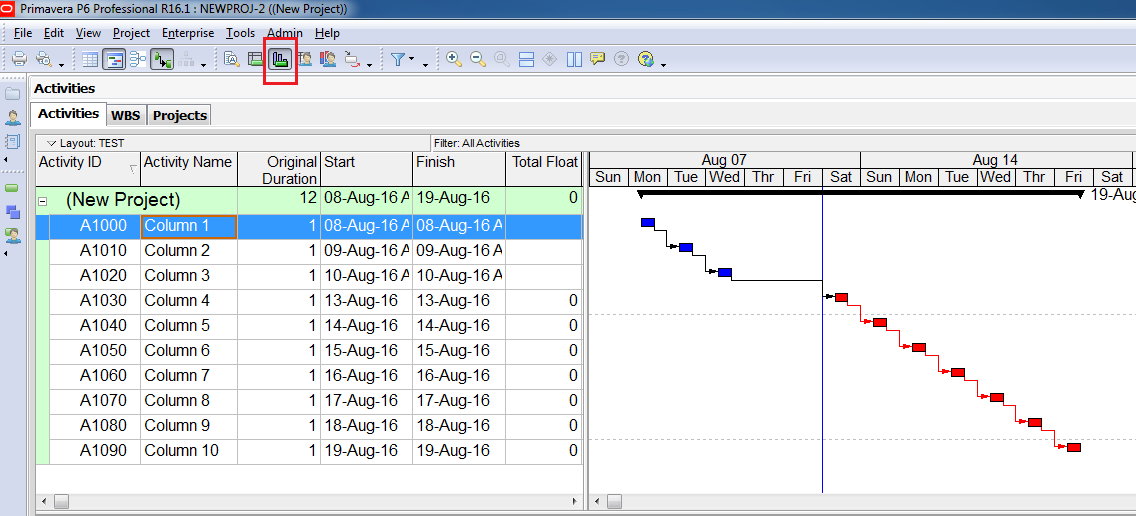
Step 7: Visualize with Diagrams
- Click Activity Usage Profile
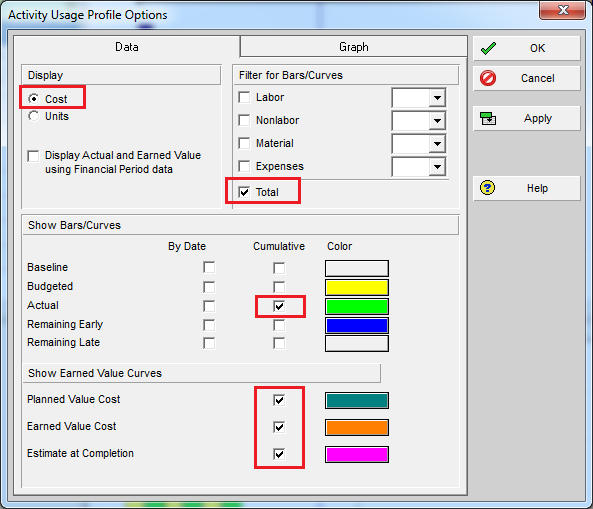
- Right-click → Activity Usage Profile Options
- Enable Earned Value display options
You’ll now see the EVM diagram with cost plotted on the right axis.


I also attach a theory diagram of Earned Value Management for your reference.
Conclusion
Using Earned Value Management in Primavera P6 allows you to track project performance, identify schedule and cost variances, and forecast total project cost accurately.

Dear,
Very nice.
Really i always wait for the post. Please post HOW TO PREPARE RECOVERY SCHEDULE
(Actual cost = plan cost) after delay or EOT) in other words bring plan % or cost equal to Earned Value.
LikeLike
Hi,
Thank you for your compliment.
I will keep your suggestion in mind and I might do it in future 🙂
LikeLike
Thanku very much sir 😍
LikeLike
Hi,
Appreciate the update on recovery schedule.
LikeLike
Yes i have also some issue’s about it
LikeLike
Simple and well explained. Thanks for sharing.
LikeLike
Dear sir,
Excellent.Refreshed with simple example yet covered all the core topics in earned value concepts.Thanks for sharing.
LikeLike
Explained a simple way.. Nice article..
LikeLike
Thanks for the nice article. I have a question regarding ETC:
What formula is used to calculate the ETC for each unit of time and draw the curve? Is this formula based on the PV?
LikeLike
Hi Evgeny,
The value to draw the curve is also the value appear on the activity table (The Estimation At Complete column).
The formula is based on what we choose in the Earned value tab. Do we consider CPI or not.
LikeLike
Nicely done, Do. Thank you for sharing.
LikeLike
Well done and straight forward example. Excellent layouts.
LikeLike
Thank you for your compliment.
I will keep your suggestion in mind and I might do it in future
LikeLike
Thanks for sharing
LikeLike
Thank you for sharing
LikeLike
Excellent work
LikeLike
Simple and clear, well done.
LikeLike
Thank you, IOU a cup of coffee!!
LikeLike
Explained in a simple way and thanks for sharing.
LikeLike
Thank you for useful explanation of EV. Everything about EV now are very clear. Can you share this explanations in pdf, please?
LikeLike
Hi.
In the “Share this” section, click on “More” button and you can see the Print button. Click on Print you can have the pdf version.
LikeLike
Hi,
Great work Keep it up.
Please share Primavera P6 Analytics installation steps.
Many thanks
Imran
LikeLike
Hi How to upload Cost in P6? I want to upload cost for Clients per tender value and for progress billing per month based on progress, not actual cost from Resources
LikeLike
very straight forward…. Thanks
LikeLike
very simple method thank u
LikeLiked by 1 person
“Schedule Variance SV = EV – PV = 300 – 500 = -200 $
A negative number indicates that the project is behind schedule.”
sir the negative sign is why not shown in primavera p6 to indicate the project is behind the schedule .
LikeLike
Hi. In P6, the cost show in parenthesis is negative value.
LikeLike
Hi,
Thanks for the nice article.
I hope you still read this blog 🙂
My question is: Why after update “Budgeted units” of A resource in task “Column 1” grown from 10 to 20? Should Budgeted Units not frozen?
LikeLike
Hi Marcin,
Good question 🙂
I did not notice that change from 10 to 20 until seeing your question.
Because Budget value is now derived from Baseline so I even don’t look at the “original” Budget field in Resource tab.
I still don’t have the exact answer for you. I guess because Actual value is 20, P6 will automatically increase Budget value to 20.
When I have time, I will check this carefully.
LikeLike
Hi,
Thanks for the reply and I am waiting patiently.
You wrote, that change of the way how Primavera calculate ETC is possible before we put update. I’ve problem with this and my Primavera react only when I chose PF = (user value) other do nothing… Did you know what is wrong with it?
LikeLike
Hi,
With the information you gave, I can’t identify the problem. It usually takes lots of time and effort to figure out the problem and solution.
LikeLike
I made simulation by use your example with not only running f9/update progress, but with option recalculate the cost , the actual cost /over budget , bring back to maximum budget; means primavera not allow the figure to be over budget
LikeLike