
By default, Primavera P6 shows only one critical path when you apply the standard critical filter. However, in complex projects, you may need to display near-critical paths or multiple float paths for better analysis.
This guide explains how to enable and display multiple critical paths in Primavera P6.
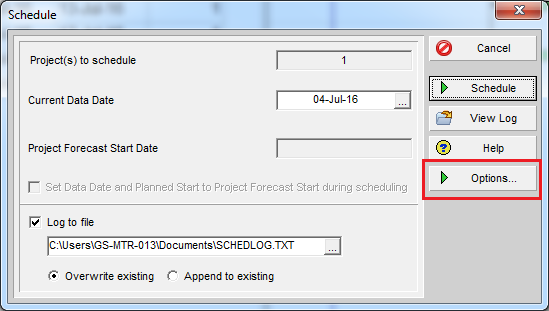
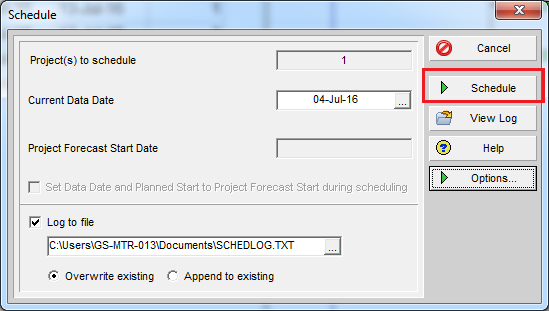
Step 1: Open the Schedule Options
- Press F9 or click Schedule.
- In the Schedule Options dialog, go to the Options button.
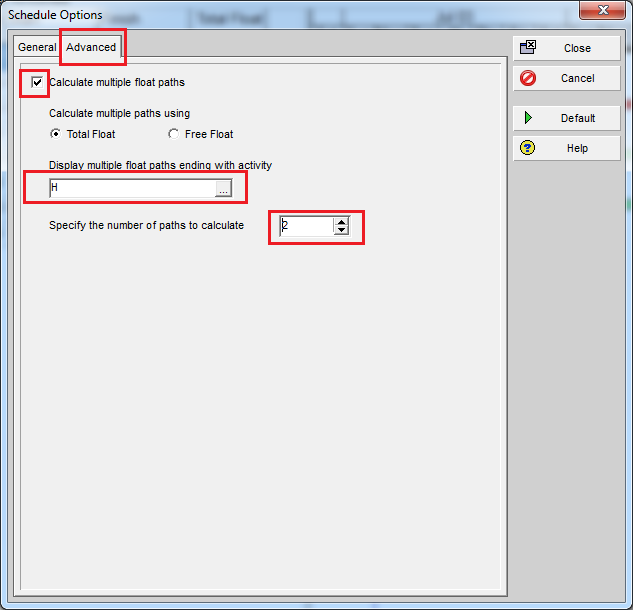
Step 2: Enable Multiple Float Paths
- Click the Advanced tab.
- Check Calculate multiple float paths.
- In Display multiple float paths ending with activity, select the last activity of your project.
- Choose the number of paths you want to display (e.g., 2 paths).
Click Close and then Schedule.
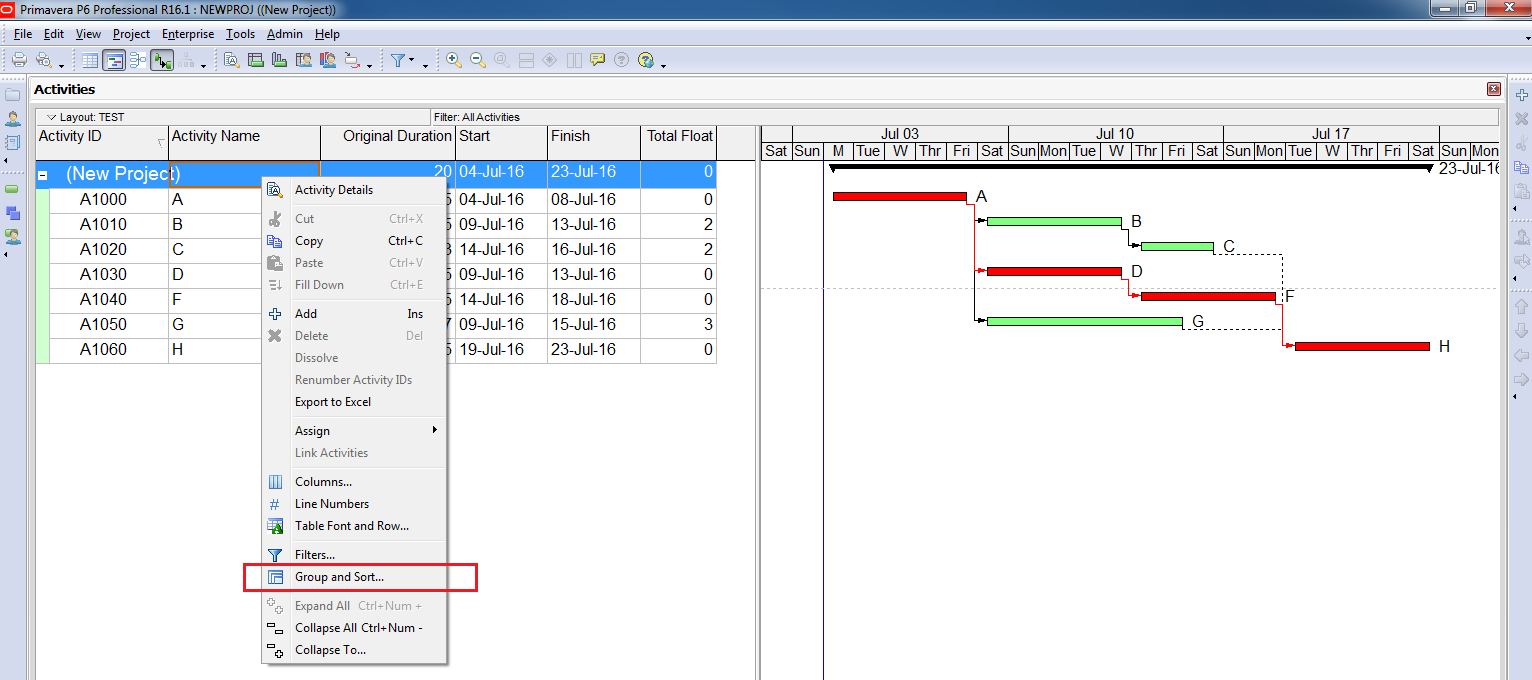
Step 3: Group Activities by Float Path
- Right-click on the Activity Table.
- Select Group & Sort.
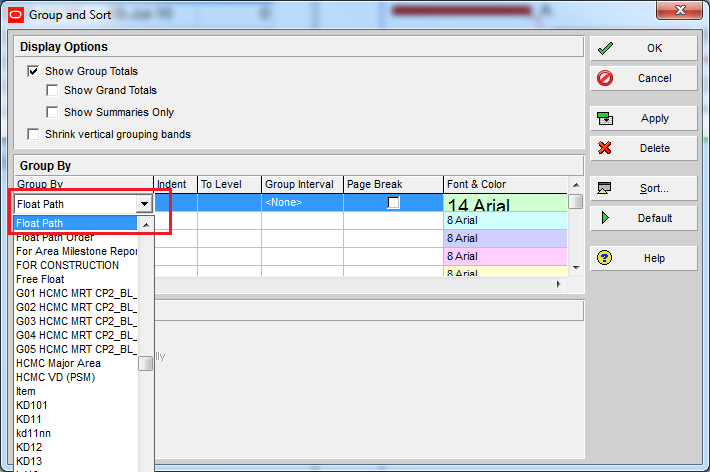
- Choose Group By: Float Path and click OK.
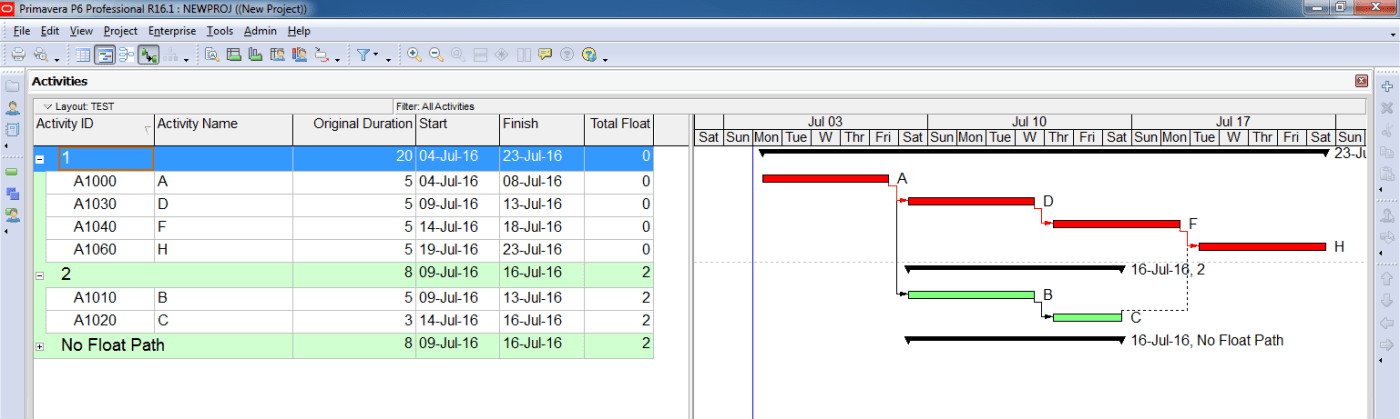
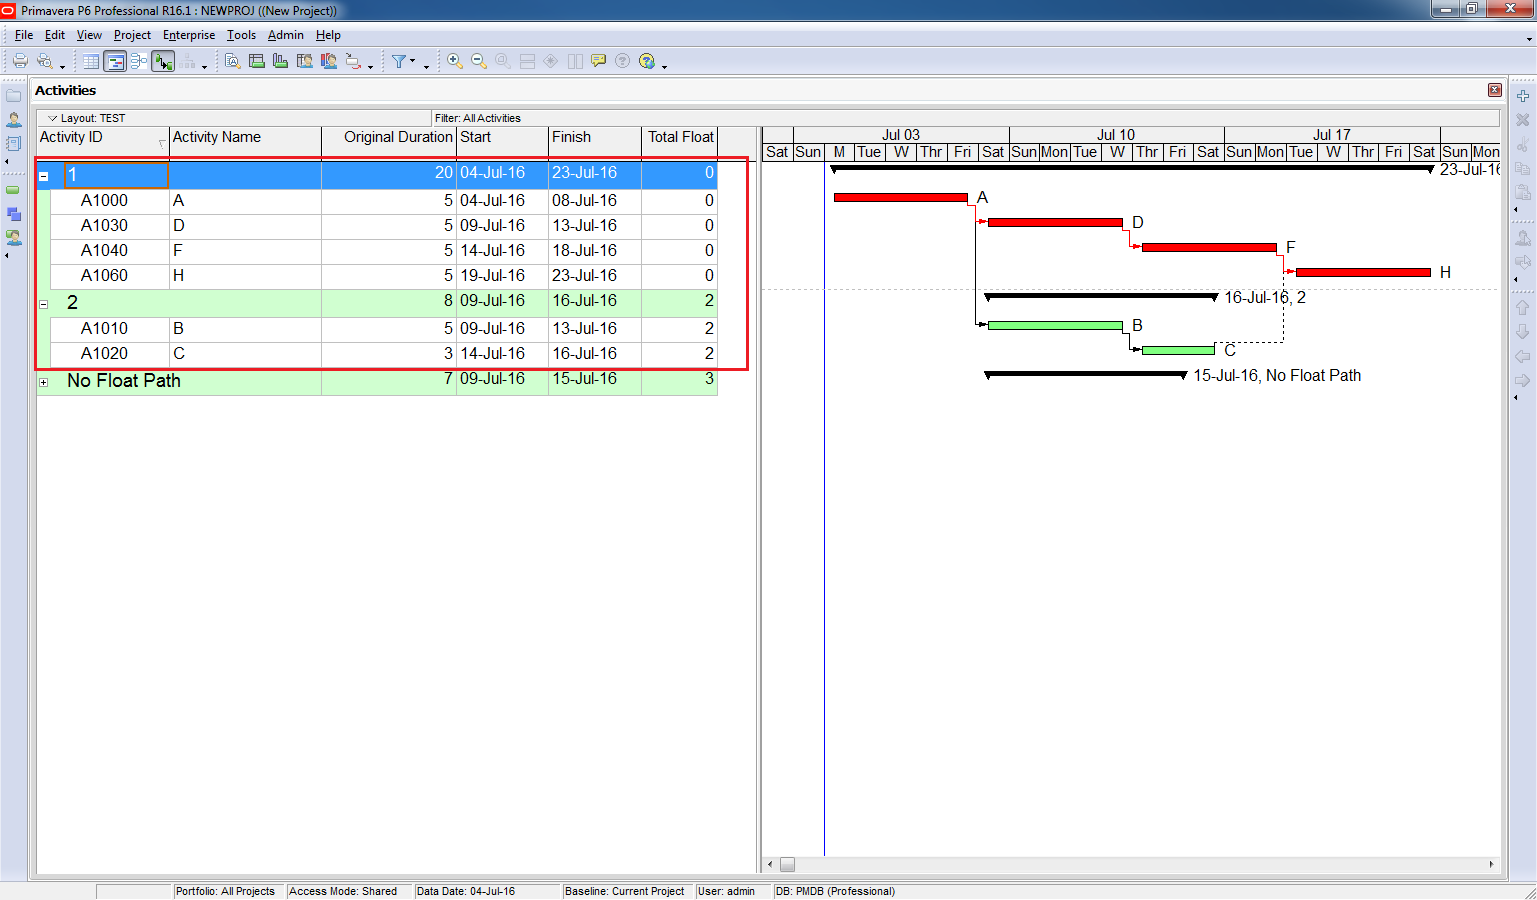
Result
Primavera will now display multiple critical paths. For example:
- Path 1: A → D → F → H
- Path 2: A → B → C → H

yes , its working the floats paths, if you then add in the group and sort “WBS” you can actually then identify the area that the path goes through, you can then assess each area.
if you are trying to do a recovery schedule and working in conjunction with the strategy and project team, you work through this to try and minimise the impacts.
remember you have done this from a “clean” new project as a demonstration, it be becomes more complex after a few updates and when there are sectional completion dates and constraints within the program,
LikeLiked by 1 person
Hi. Thanks for your suggestion.
LikeLike
Great tip, thanks for that
LikeLike
Thank you so much. Now I need not waste my time tracing n tagging the diff path using activity code!!!
LikeLike
That’s ok, but it doesn’t work for me. It may be because I have a programme that is in mid-project with lots of updates in the past. I have scheduled, using the Longest Path Option and then, on the advanced tab using the process described above. I calculated a total of five float paths.
When I reviewed the results I find that the Longest path, which I would expect to be contained entirely in Float Path 1 (as described in this blog), is actually spread across float paths 1 to 5. In fact, there are two activities in the longest path which are not classified in the float paths 1-5.
I have looked at this several times before with different projects but come up with the same result every time.
Any ideas?
LikeLike
For project which has actual data, you should choose the Free Float option. Can you try it again?
I also have another article regarding critical path, you can read it here https://doduykhuong.wordpress.com/2016/01/12/create-critical-path-for-any-activity/
LikeLike
Hi and sorry for asking the same question again, but refer to your reply why I should use the free float option for projects which have actual dates.
LikeLike
Hi,
For project which has actual data, when you identify critical path based on Total Float, it may not be corrected.
Using Free Float in this case will give you accurate result.
For now I don’t have any example to prove it. But may be one day when I have one, I will post it 🙂
LikeLike
Hi , thank for the amazing information, I have a question why you used total float and not free float.
LikeLike
You can Choose this option to define critical float paths based on longest path
LikeLike
Nice blog and i like to suggest Proventures for best primavera training institute in hyderabad
LikeLike
thanks for that
LikeLike
That was a great tip and extremely helpful. thanks
LikeLike
Awesome, thanks!
LikeLiked by 1 person