

When creating a stacked histogram in Primavera P6, you may notice that the legend does not appear by default in the printed report. This can make the report difficult to interpret, especially when multiple resources are displayed.
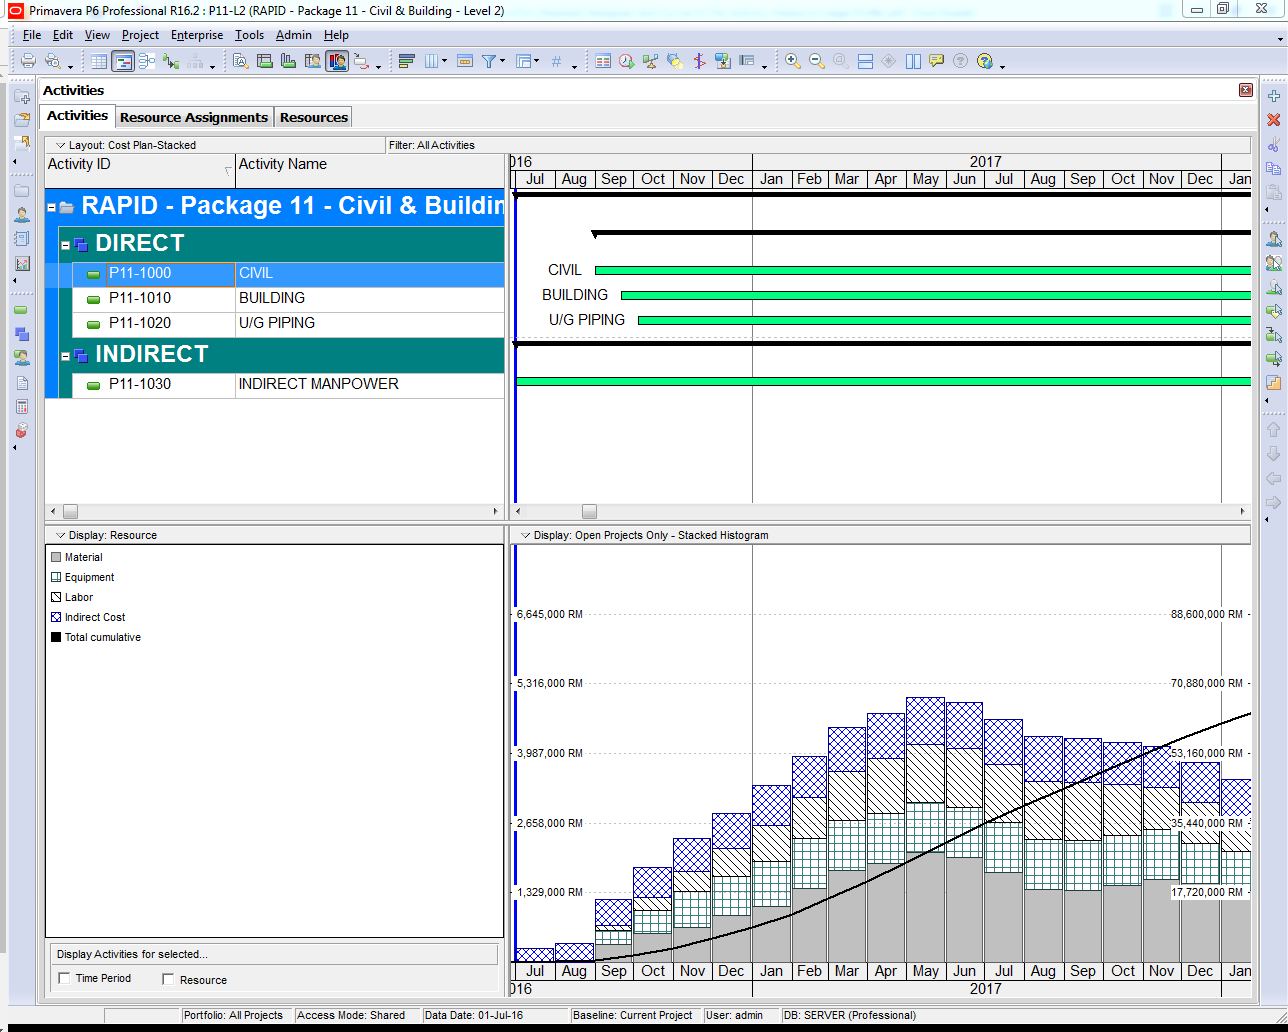
For example, in the stacked histogram view (see image below), there is no visible option to include the legend:

In contrast, for other types of diagrams (non-stacked), Primavera P6 provides a straightforward option to display the legend:

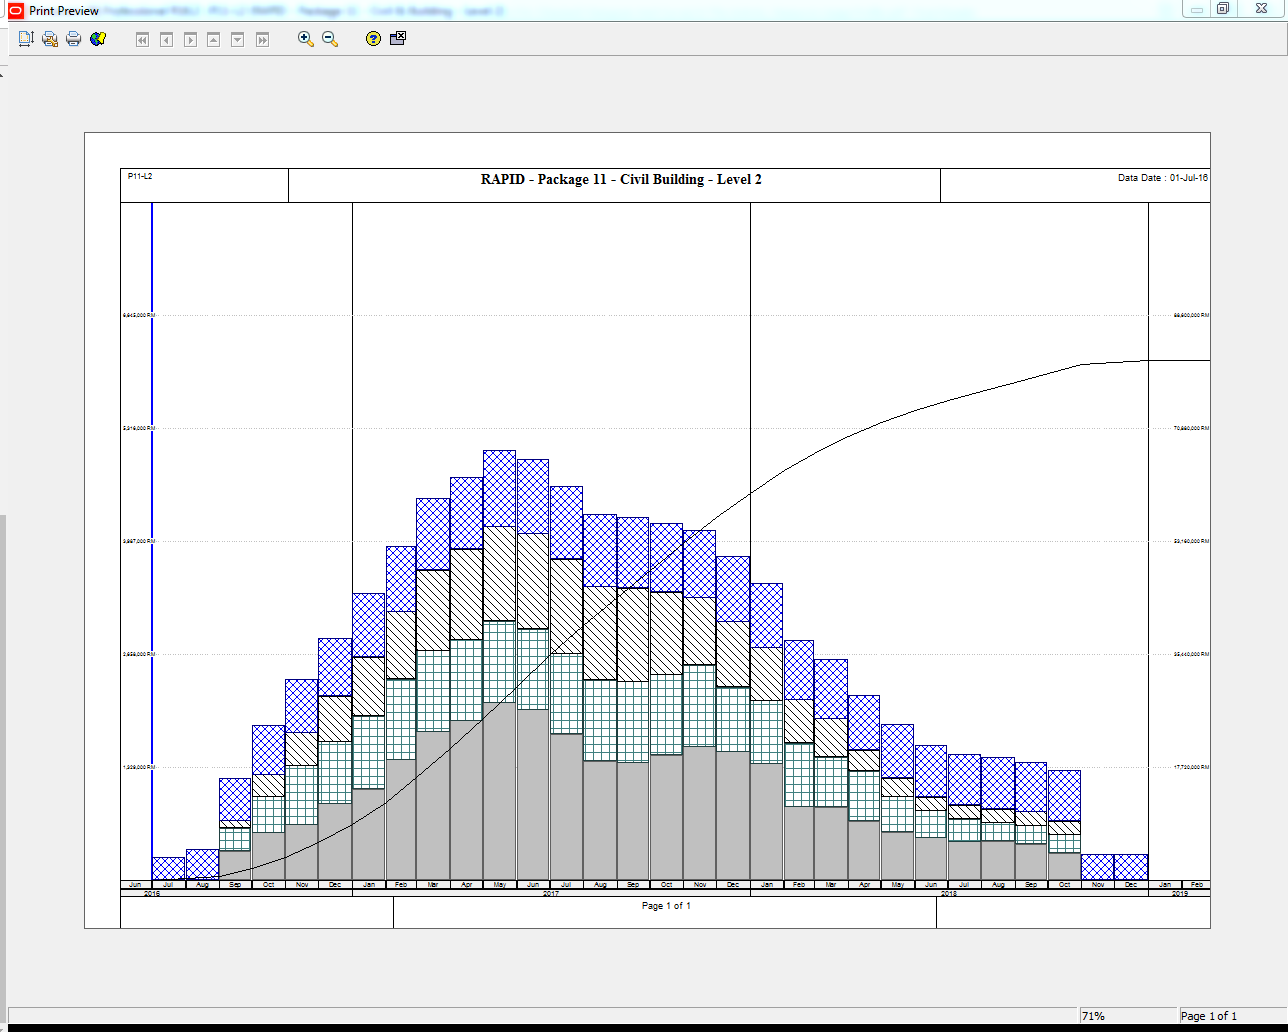
Without the legend, the report becomes hard to understand:
Solution: How to Show the Legend in the Printed Report
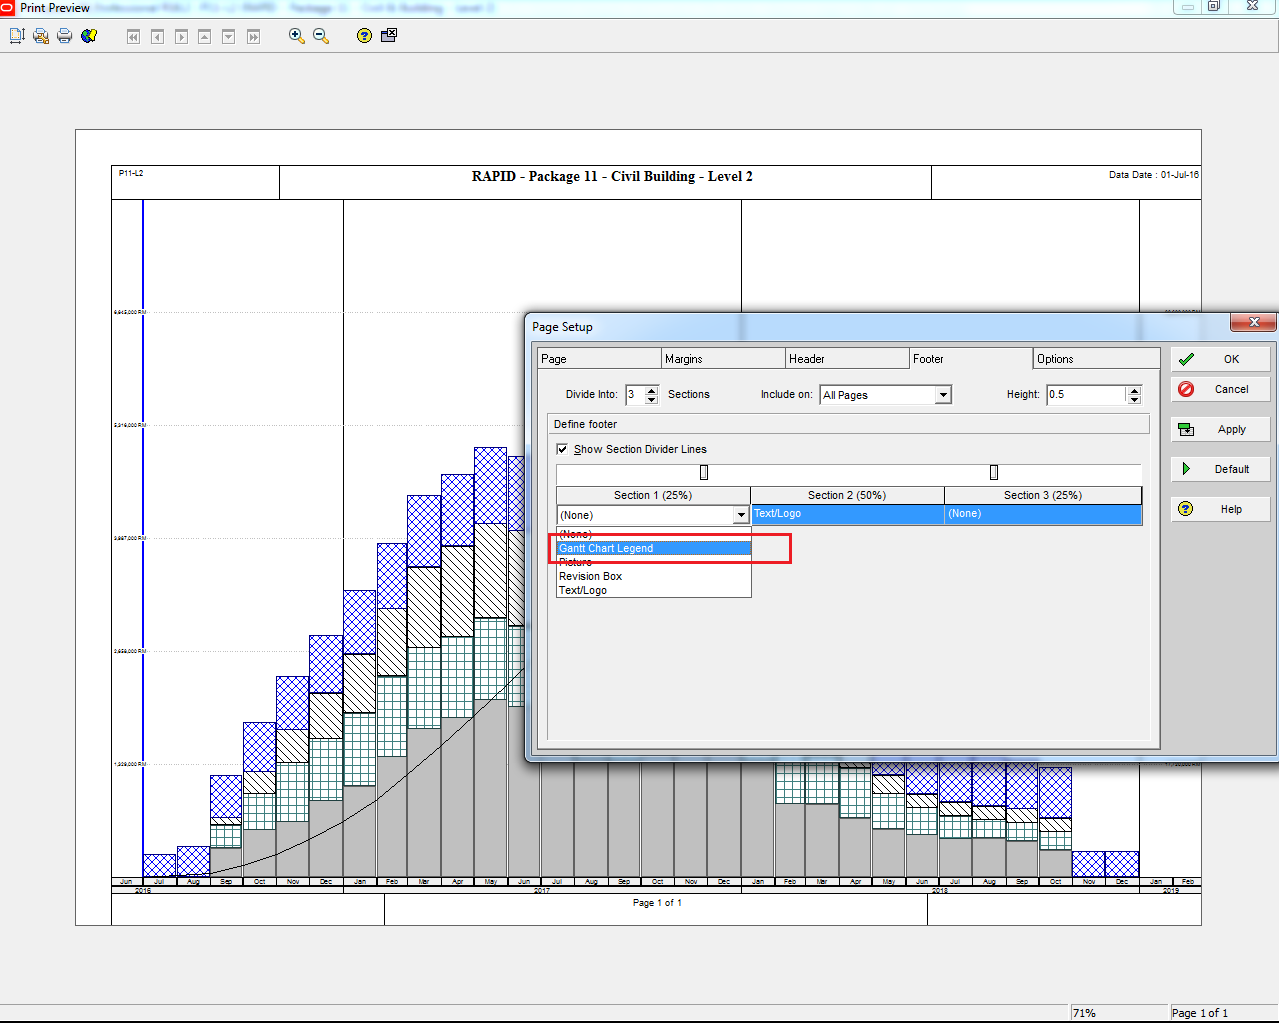
To include the legend in your printed stacked histogram report, follow these steps:
- Go to Print Preview.
- Click on Page Setup.
- Navigate to the Footer tab.
- Check the option Show Gantt Chart Legend.
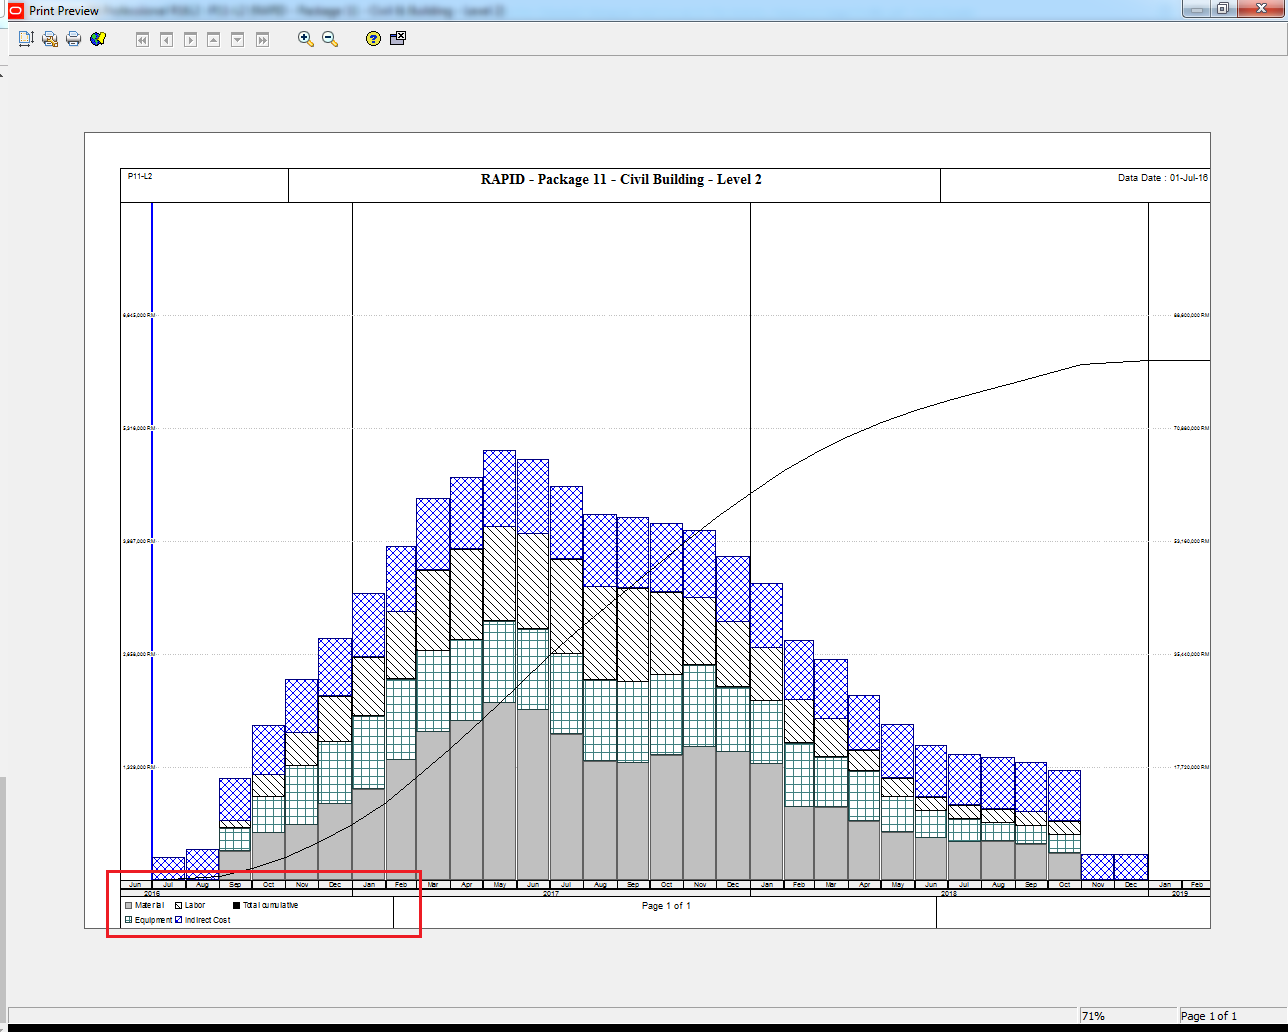
After enabling this setting, Primavera P6 will include the legend in your printed report:

Hi, what is the right method when your resource changed its unit rate along the course of the project providing that it only affect the current date and so on, because what I have observed it will give a retroactive effect. Thanks
LikeLike
Hi,
In Resource window -> Select resource you need to adjust rate -> in Units & Prices tab -> you can add a new rate, and enter the Effective date. So that the new price is only used from “Effective date”.
LikeLike
Thanks really help a lot!!!
LikeLike
your articles are very good. i read some of them, quite to the point and guide reader how to do step by step.
LikeLiked by 1 person
Thank you 🙂 I’m very happy when you enjoy my blog
LikeLike
Hi, I get this. But I am trying to print a view which has the Gantt chart at the top and a stacked histogram at the bottom. Just a small project so it all fits on the 1 page.
Unfortunately I can’t get it so that it shows the legend for both the Gantt and the Histogram. In fact it ONLY shows the legend for the Gantt (which is pretty self explanatory anyway). And I have no idea which bar is which on the Histogram, which makes it next to useless.
How do i get it so that I can show both the Gantt and the Histogram (I can do that bit) AND the legend for both or just the legend for the Histogram?
Thanks,
LikeLike