
Let’s assume we have an activity with a duration of 100 days and 100 labor units.
By default, the resource distribution follows a linear spread.
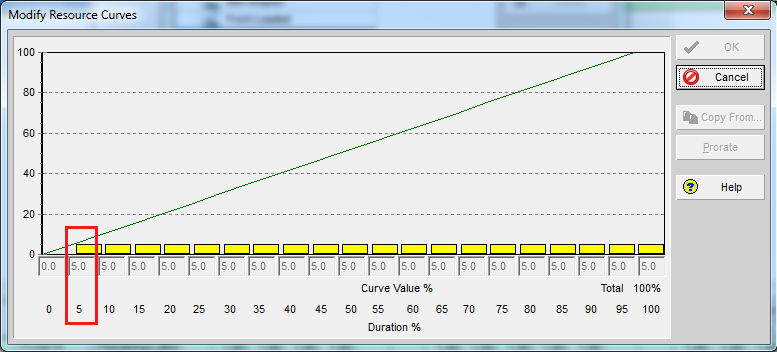
This means that the resources are distributed evenly over time.
For example:
- At 5% of the duration (Day 5), you will have used 5% of the total units (5 units).
- The resource usage is spread uniformly across that period.

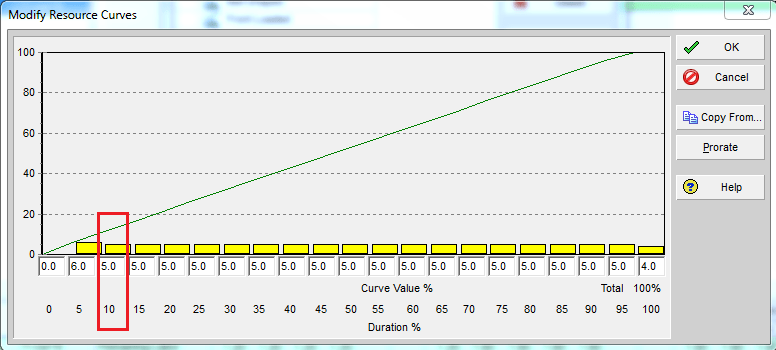
If we modify the curve so that it reaches 6% at 5% of the duration:
- At Day 5, instead of 5 units, you will have 6 units completed.
- These 6 units are still distributed evenly within the first 5 days, but at a slightly higher rate


For the next interval:
- At 10% of the duration (Day 10), an additional 5% of total units (5 units) is assigned.
- These units are again evenly spread across that time period.
This pattern continues, following the defined curve shape until the activity is completed.


Key Takeaway
A resource curve controls how resource units are distributed over time:
- A linear curve spreads resources evenly.
- A non-linear curve (like 6% at 5% duration) shifts more or fewer resources to specific periods.
By adjusting the curve, you can better match resource allocation to real project needs, whether you want front-loaded, back-loaded, or balanced distribution.

Leave a comment