

When applying the Earned Value Management (EVM) technique in Primavera P6, one of the key metrics is Planned Value (PV), which is calculated as:
- Planned Value (PV) = Budget at Completion (BAC) × Schedule % Complete
- Earned Value (EV) = BAC × Performance % Complete (typically equal to Activity % Complete)
- Schedule Variance (SV) = EV – PV
A positive SV indicates the project is ahead of schedule, making Planned Value a critical component in project performance analysis.
Linear vs. Non-Linear Resource Distribution
By default, when a resource is assigned to an activity, Primavera P6 distributes the units linearly across the activity duration. In this case, Schedule % Complete is calculated based on time elapsed, and PV is computed accordingly.
However, in real-world scenarios, resource usage is rarely linear. We often adjust resource units manually or apply Resource Curves to reflect realistic work distribution over time.
How Planned Value is Calculated with Resource Curves
Let’s explore how Primavera P6 handles non-linear resource distribution using Resource Curves.
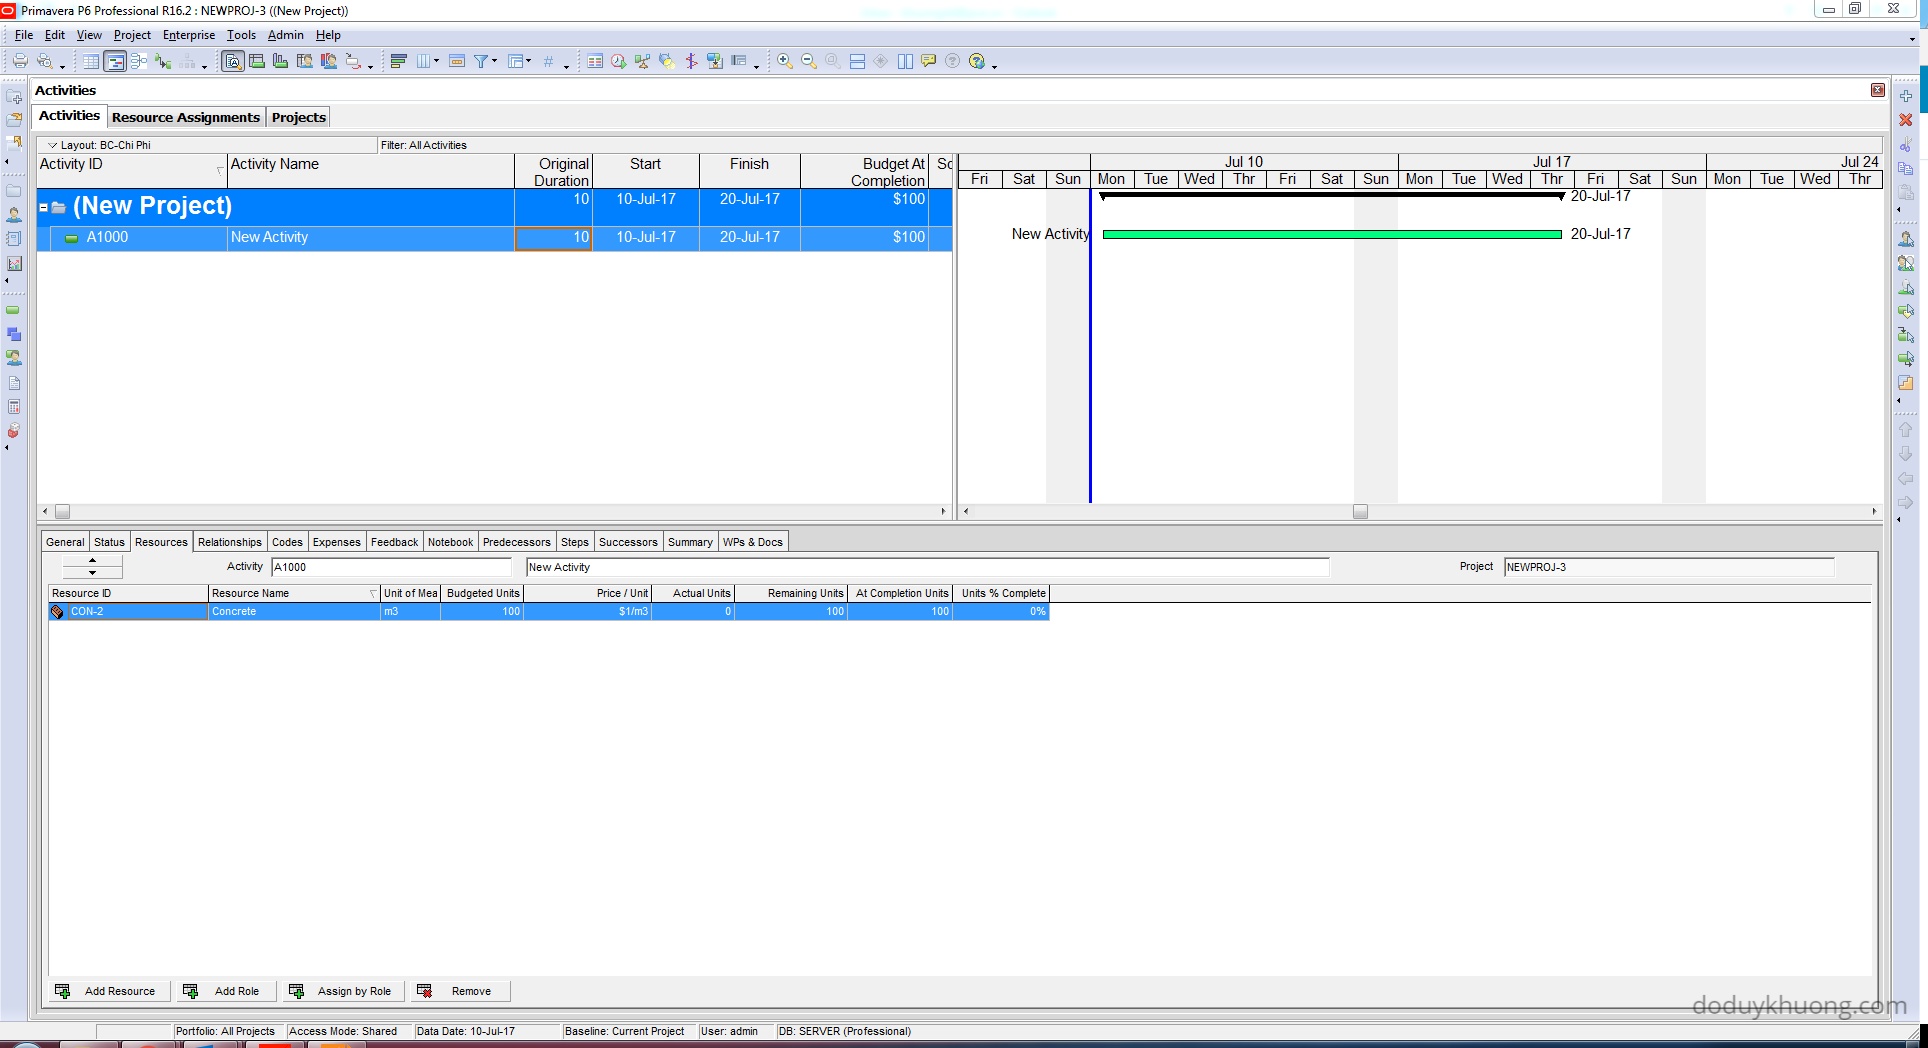
Example Scenario
- Activity Duration: 10 days
- Resource Assignment: Uses the Back Loaded curve
- BAC: $100
- Current Day: Day 5
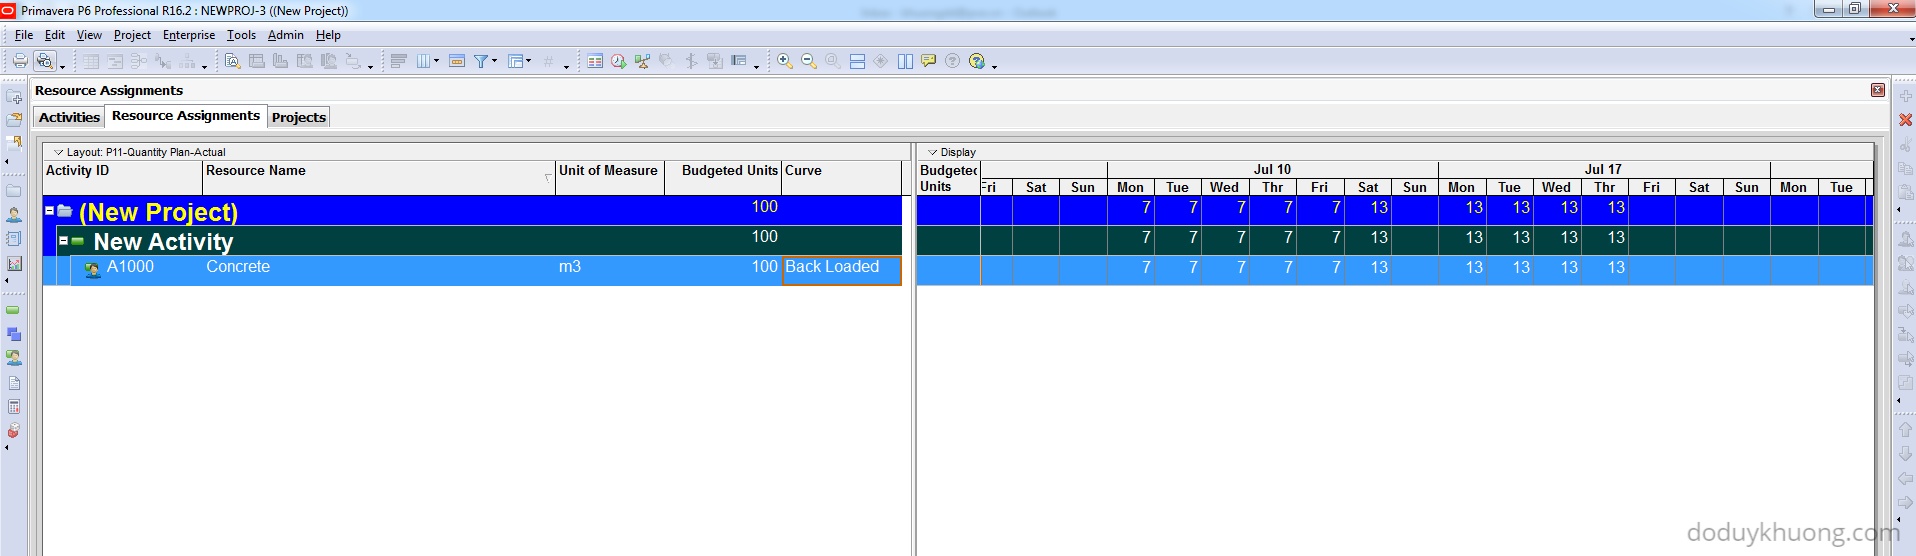
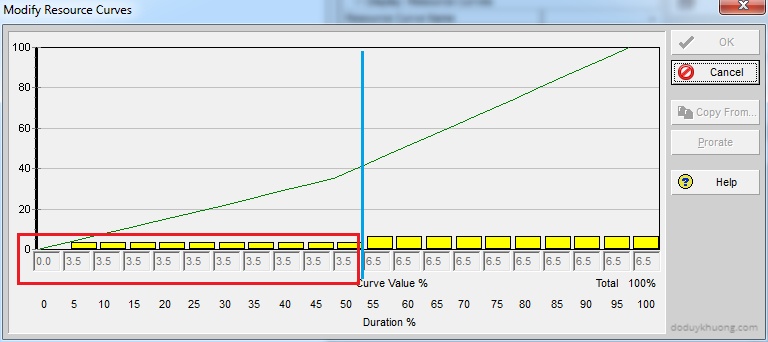
The Back Loaded curve divides the activity duration into 5% intervals, assigning a specific percentage of work to each interval. For example:
- From 0–5% of duration: 3.5% of work
- From 50–55% of duration: 6.5% of work
…and so on.

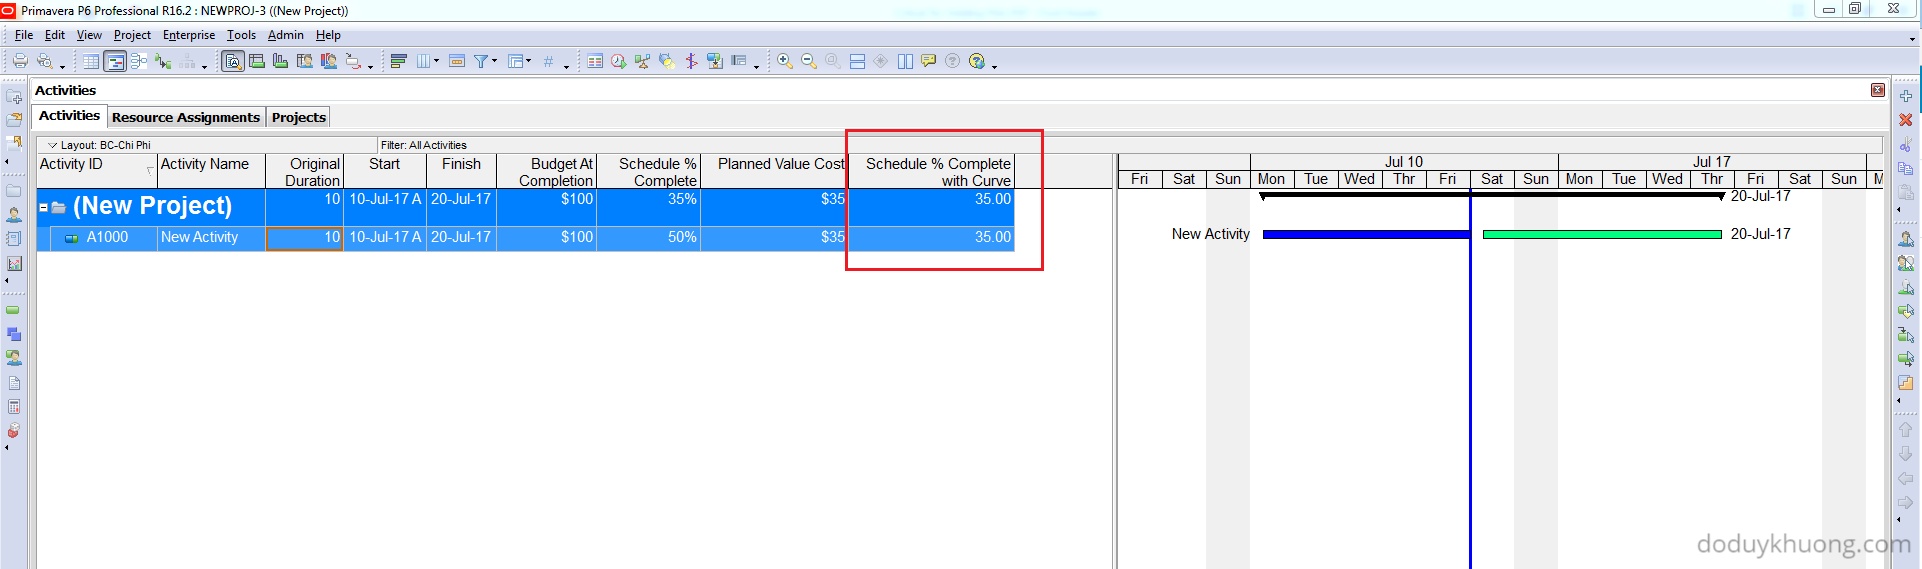
At Day 5 (50% of duration), we sum the curve percentages for the first 10 intervals:
Schedule % Complete with Curve = 3.5 + 3.5 + … (10 intervals) = 35% (calculated at Resource Assignment level)
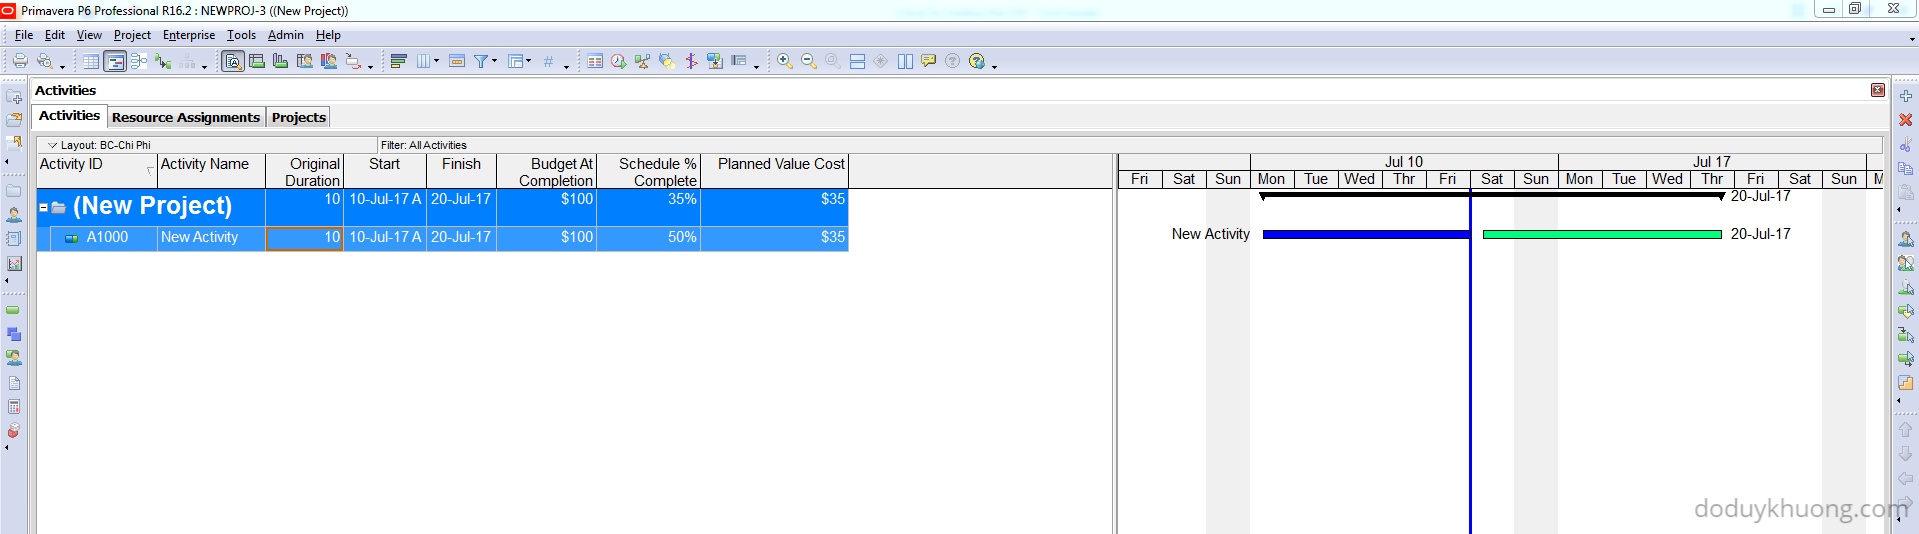
Then:
Planned Value (PV) = 35% × $100 = $35 (calculated at Resource Assignment level)
Note: Primavera P6 still shows Schedule % Complete as 50% by default (at Activity level), because it assumes linear distribution. This does not reflect the actual planned work based on the curve.
Displaying “Schedule % Complete with Curve” in Primavera P6
To reflect the curved distribution in your project data:
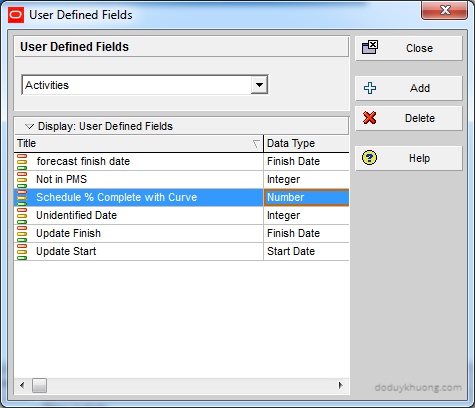
- Create a User Defined Field (UDF)
- Go to Enterprise > User Defined Fields
- Create a new UDF for Activities called
"Schedule % Complete with Curve"with Number as the data type.
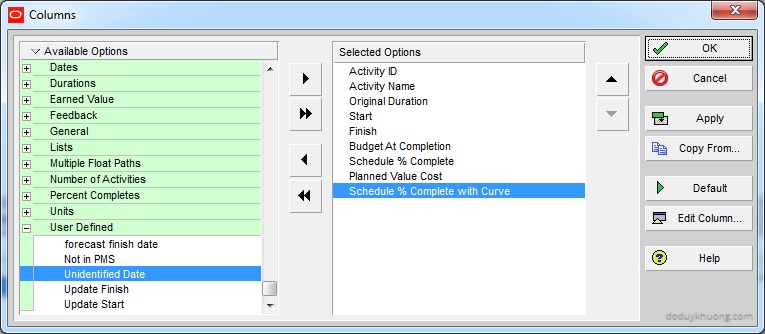
2. Add the UDF to the Activity Layout
-
- In the Activities view, add the new UDF as a column.
3. Create a Global Change
- Go to Tools > Global Change
- Create a new change for Activities:
Then Schedule Curve % Complete = Planned Value Cost / Budget At Completion
And Schedule Curve % Complete = Schedule Curve % Complete * 100

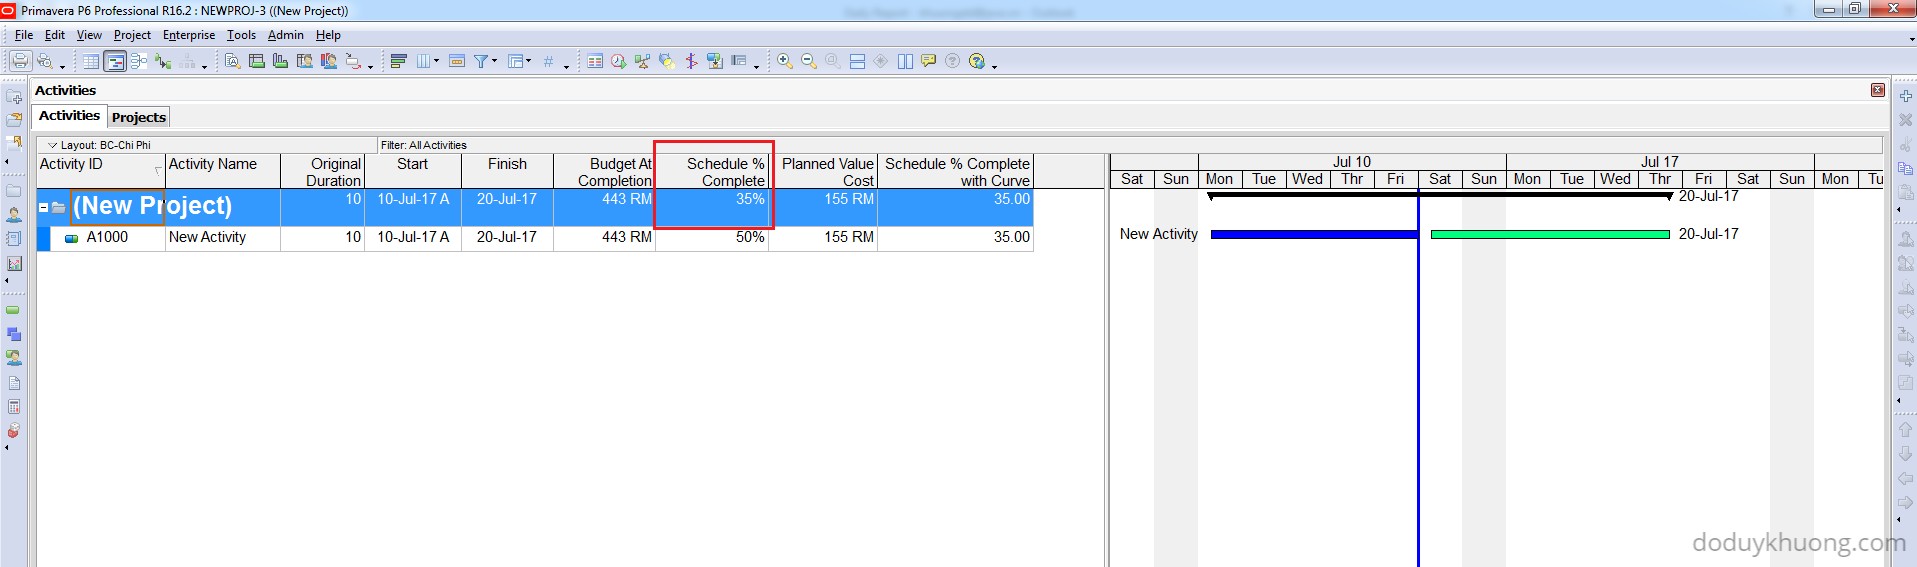
4. Run the Global Change
-
- This will populate the UDF with the correct curved schedule percentage.
Summary Schedule % Complete for WBS
If you want to see the summary Schedule % Complete with Curve at the WBS level, Primavera P6 already calculates this correctly using:
Summary Schedule % Complete = Summary PV / Summary BAC
Mixed Resource Assignments: Curved and Non-Curved
If an activity has multiple resource assignments—some using curves and others not—Primavera P6 calculates the Planned Value for each assignment using the appropriate method (curved or linear), and then sums them at the activity level. This ensures accurate PV values regardless of the resource distribution method.

Really didnt understand.
LikeLike
🙂
LikeLike
Clearly understood. Very helpful indeed!
LikeLiked by 1 person
Hi,
Thank you for writing this article at a correct time (at least for me). However, in your program you have taken only one activity hence when you used Activity type as Number it does not matter. In my program there are many activities some of which do have a resource curve. In this scenario it adds up the value (since its a number) and does not give a percentage .
I am not sure whether there is work around. If there is please do write it in your future articles. Thank you
Viral
LikeLike
Hi Viral,
That’s a very interesting question.
When you have multiple activities in WBS, and you need to see the summaried “Schedule % Complete with curve”, you can look at the default Schedule % Complete. Its calculation is Summary PV / Summary BAC
LikeLike
In my project we have 3 types of curves, For Engineering we have front loaded, for procurement its back loaded and for construction it is Bell Shape. Each and every activity is having non labor units assigned. In this case when I am updating my schedule the Schedule % progress will still consider linear distribution or it will consider on the basis of the curve assigned? Because if planned progress is considered on the basis of resource curve assigned then i dont thik so I need to use this global change.
Ketan
LikeLike
Hi Ketan,
For Activities having Both ‘Curve’ And ‘Non-Curve’ Resources
If an Activity features multiple resource assignments, some of which use Resources Curves, and some of which do not, then the Planned Value will be calculated correctly for each resource assignment, using the appropriate method, and then summed at the activity level.
LikeLike
very helpful.
i want to learn more details in primavera.
please send me your mobile number message on whatsap.
my mobile number +919898331003.
LikeLike
Hi Parthiv.
I can be reached at my facebook page : https://www.facebook.com/doduykhuongblog/
See you there.
LikeLike
This is a second paper that I read, and second time I don’t see an illustration of the baseline schedule. This is a beauty of P6 that u can compare planned and actual values.
LikeLike
Hi Oleh.
I’m still not sure what does it mean by “illustration of baseline schedule”. However I have an article regarding How to update Baseline in Primavera P6. You can read it here https://doduykhuong.com/2016/09/06/how-to-update-baseline-in-primavera-p6/
LikeLike
Thanks, great information. I have a question, how do you manage variations (lets say extra scope) in the EV? do you treat them as separate or add them to the current total scope and recalculate?
The issue is the %complete changes if you increase the units isn’t it? Do you have any example? Thanks
LikeLike
HI Mali,
That’s an interesting question.
So far I still have not encounter your situation. When I do, I will surely share my solution with you guys.
LikeLike